Fig. 2
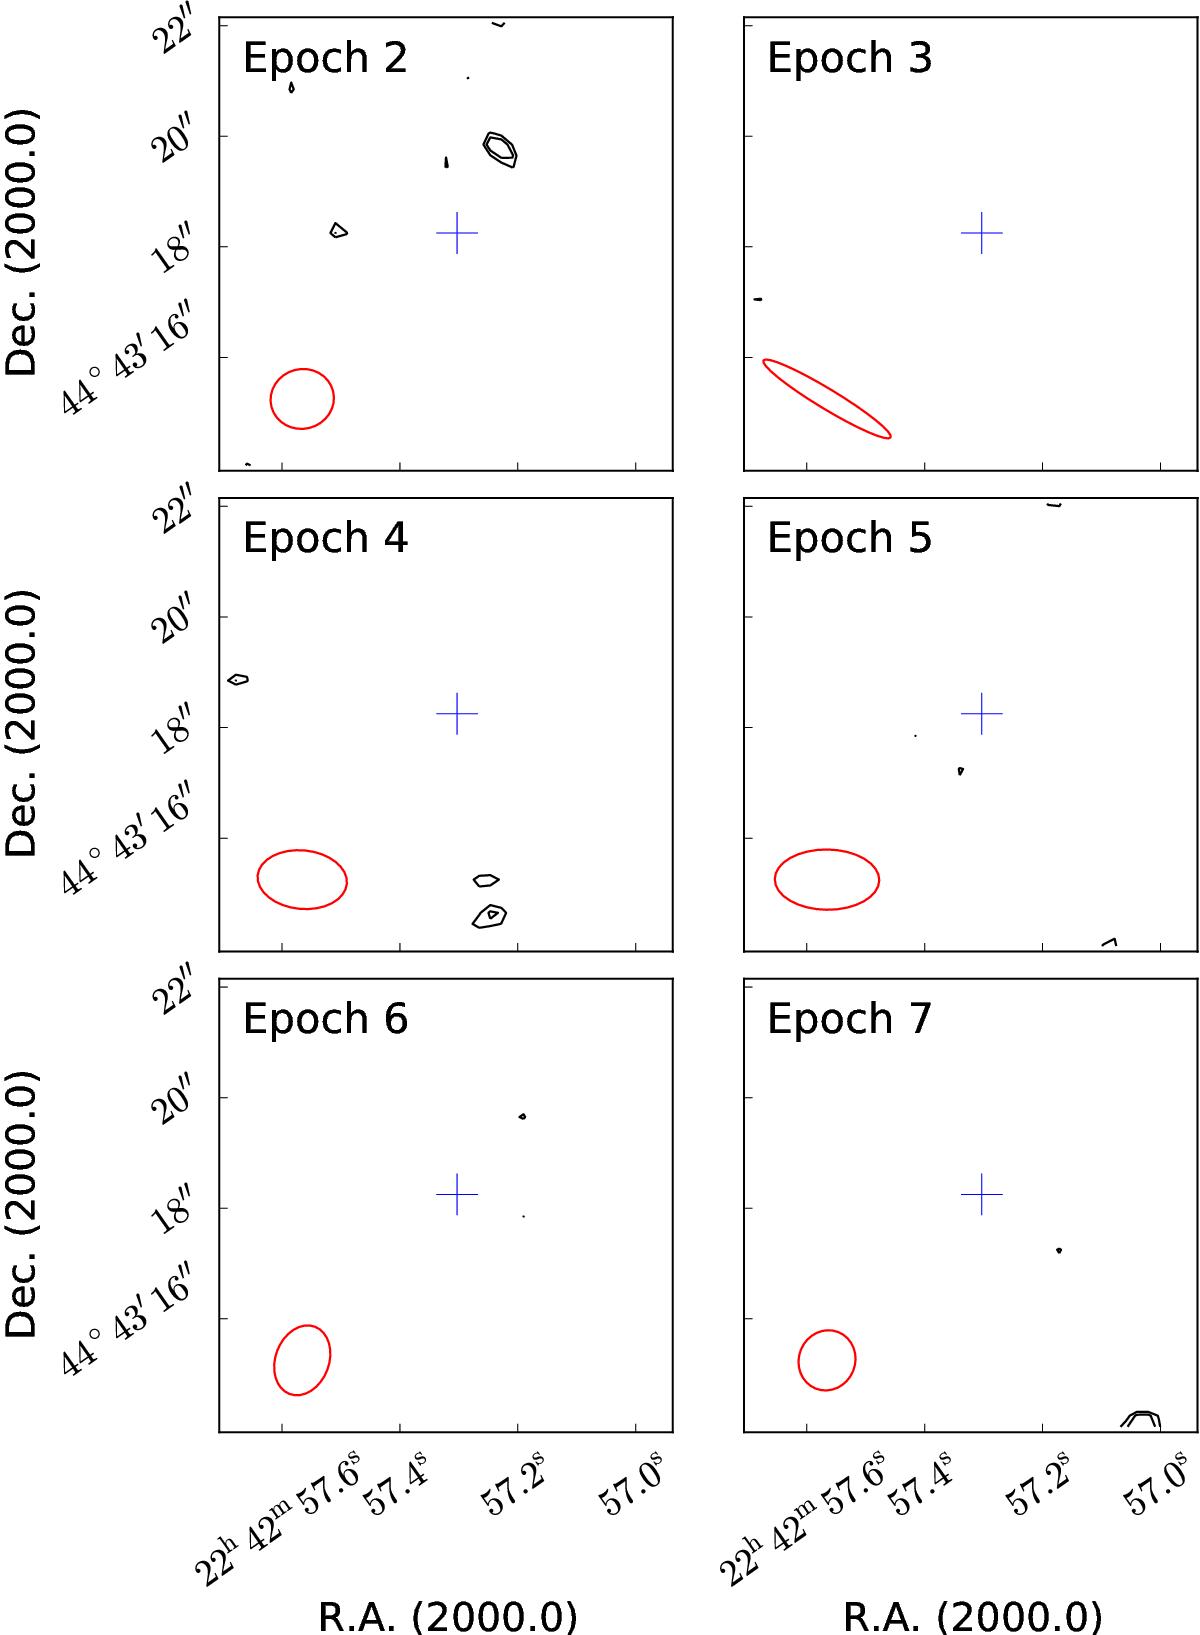
VLA images from epoch 2 to 7. The red circle at bottom-left is the synthesized primary beam. Contours are at −3, 2.6, and 3 times the noise level. The blue cross at the center represents the position of MWC 656. The source remains undetected in each single image. The rms of the images and upper limits for the flux density of MWC 656 are given in Table 1.
Current usage metrics show cumulative count of Article Views (full-text article views including HTML views, PDF and ePub downloads, according to the available data) and Abstracts Views on Vision4Press platform.
Data correspond to usage on the plateform after 2015. The current usage metrics is available 48-96 hours after online publication and is updated daily on week days.
Initial download of the metrics may take a while.