Fig. 3
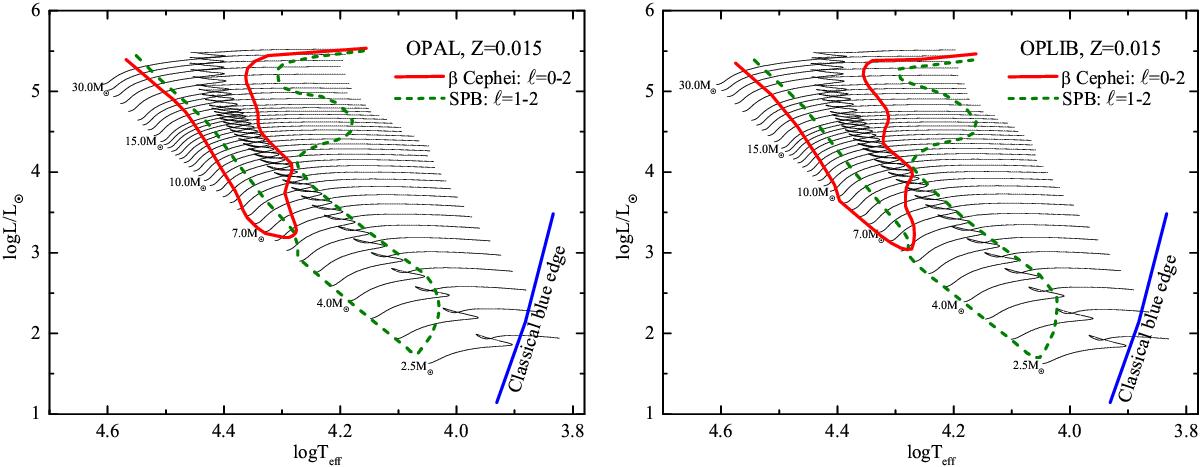
HR diagram with evolutionary tracks for masses M = 2.5−30 M⊙ and metallicity Z = 0.015. The thick solid lines indicate the unstable low-order p- and g-type modes of degrees ℓ = 0 − 2. Thick dotted lines show the high-order g-mode instability domain. In the left and right panels, we assumed the OPAL and OPLIB opacity data, respectively.
Current usage metrics show cumulative count of Article Views (full-text article views including HTML views, PDF and ePub downloads, according to the available data) and Abstracts Views on Vision4Press platform.
Data correspond to usage on the plateform after 2015. The current usage metrics is available 48-96 hours after online publication and is updated daily on week days.
Initial download of the metrics may take a while.