Fig. 1
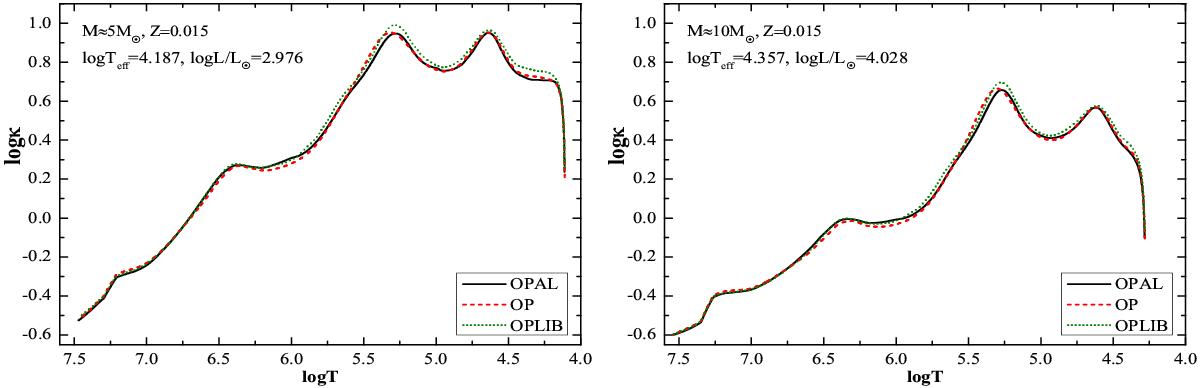
Comparison of the Rosseland mean opacity coefficient plotted as a function of temperature inside of stellar models with masses of about 5 M⊙ (left panel) and 10 M⊙ (right panel). We used metallicity Z = 0.015 and the element mixture by Asplund et al. (2009). Different lines correspond to different opacity tables (solid line − OPAL, dashed line − OP, and dotted line − OPLIB).
Current usage metrics show cumulative count of Article Views (full-text article views including HTML views, PDF and ePub downloads, according to the available data) and Abstracts Views on Vision4Press platform.
Data correspond to usage on the plateform after 2015. The current usage metrics is available 48-96 hours after online publication and is updated daily on week days.
Initial download of the metrics may take a while.