Fig. 2
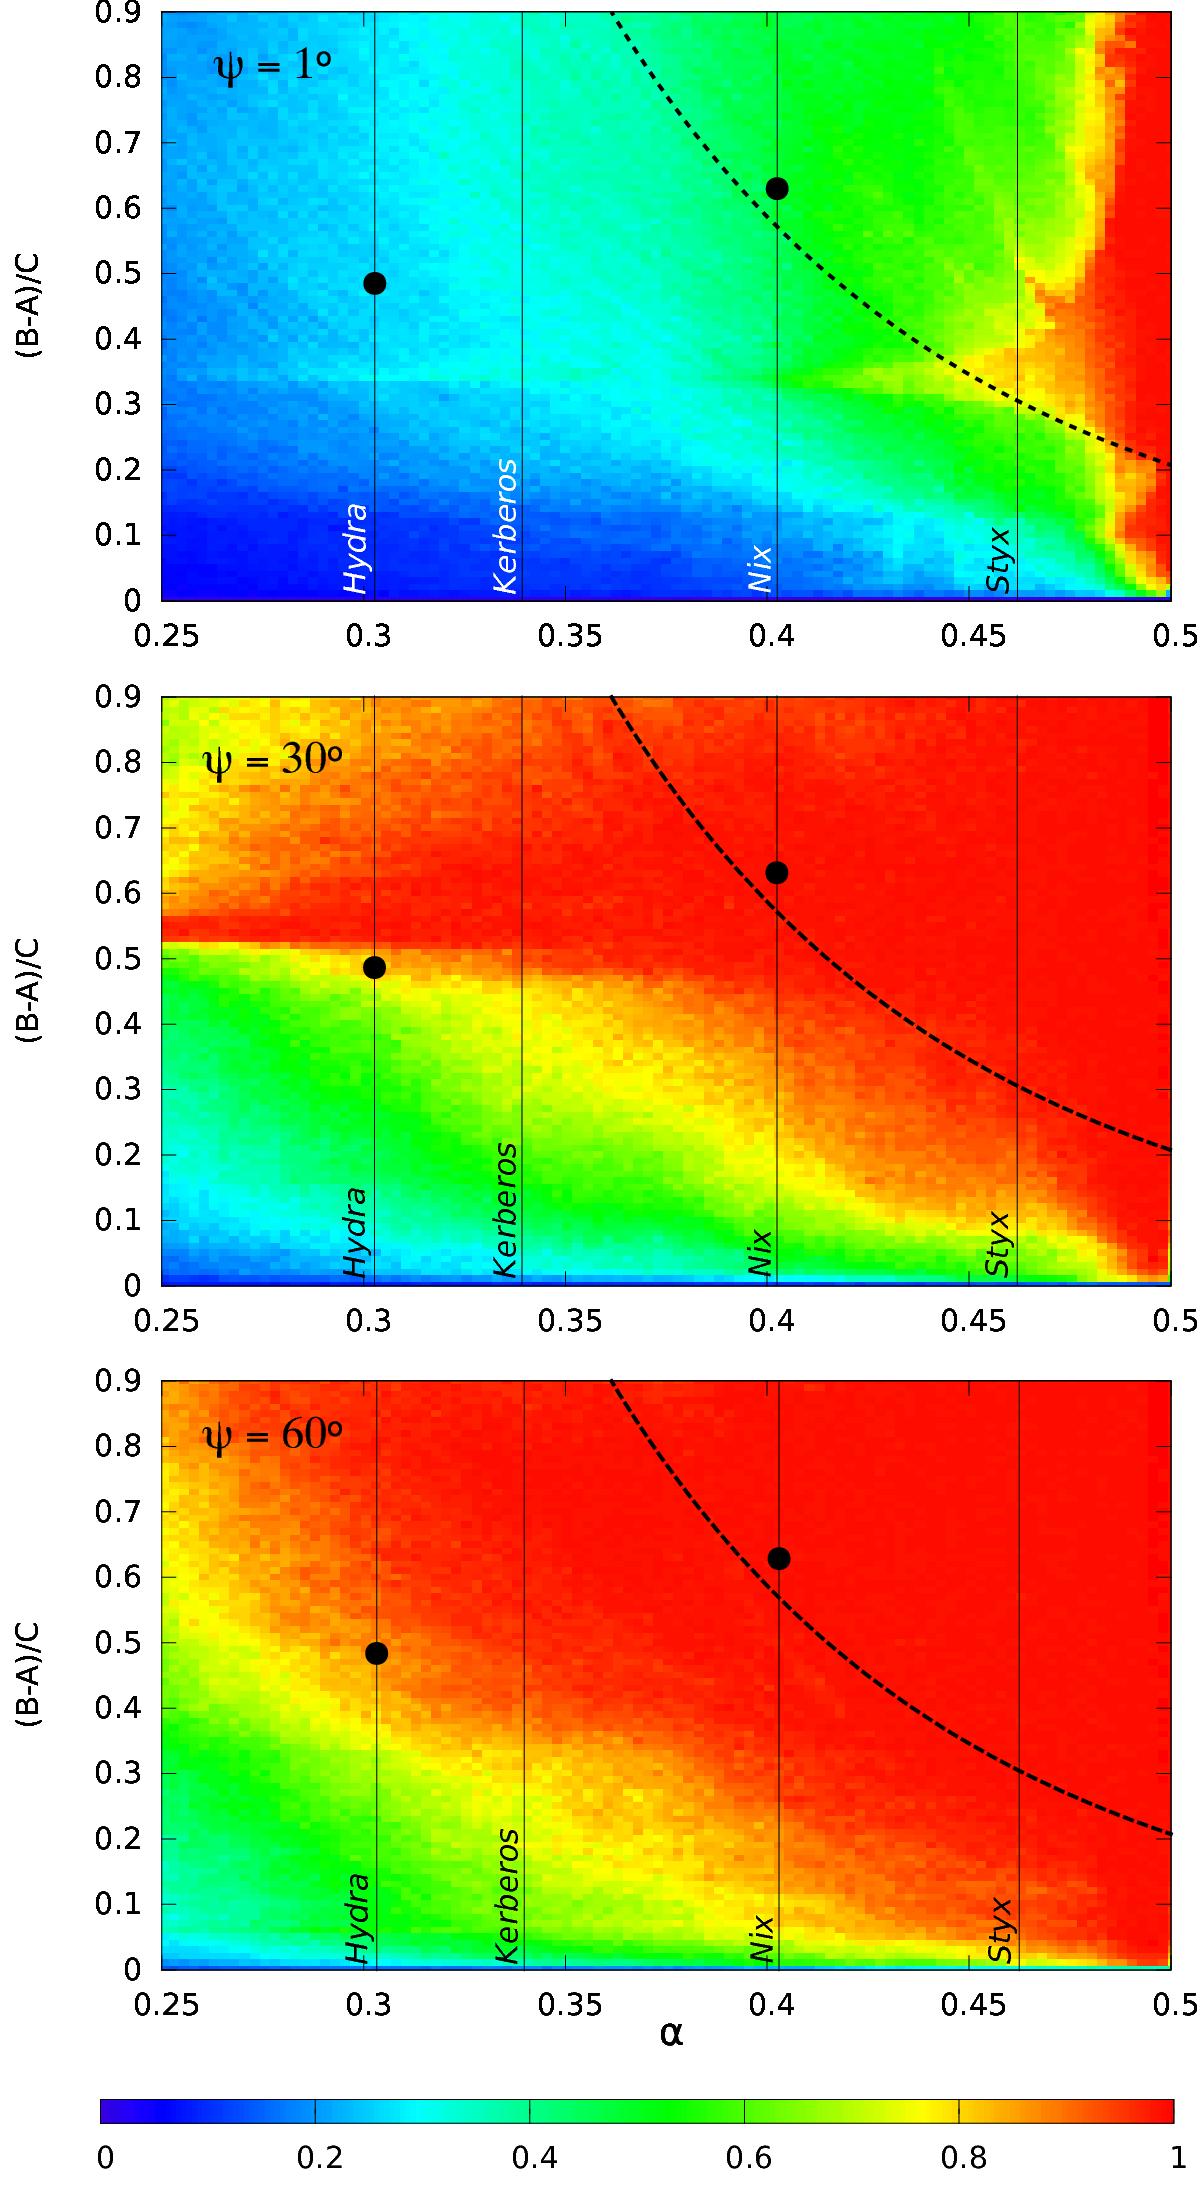
Stability analysis of the rotation rate close to the synchronization for δ = 0.1, α ∈ [ 0.25:0.5 ], and (B − A) /C ∈ [ 0:0.9 ]. We adopt three different initial obliquity values ψ = 1°, 30°, and 60°. The color index indicates the proportion of chaotic orbits inside the studied domain: from dark blue for fully regular to red for entirely chaotic. The dashed line (Eq. (11)) roughly delimits the zone where chaotic motion is possible. The dots identify two representative cases that we detail in Fig. 3.
Current usage metrics show cumulative count of Article Views (full-text article views including HTML views, PDF and ePub downloads, according to the available data) and Abstracts Views on Vision4Press platform.
Data correspond to usage on the plateform after 2015. The current usage metrics is available 48-96 hours after online publication and is updated daily on week days.
Initial download of the metrics may take a while.