Fig. 1
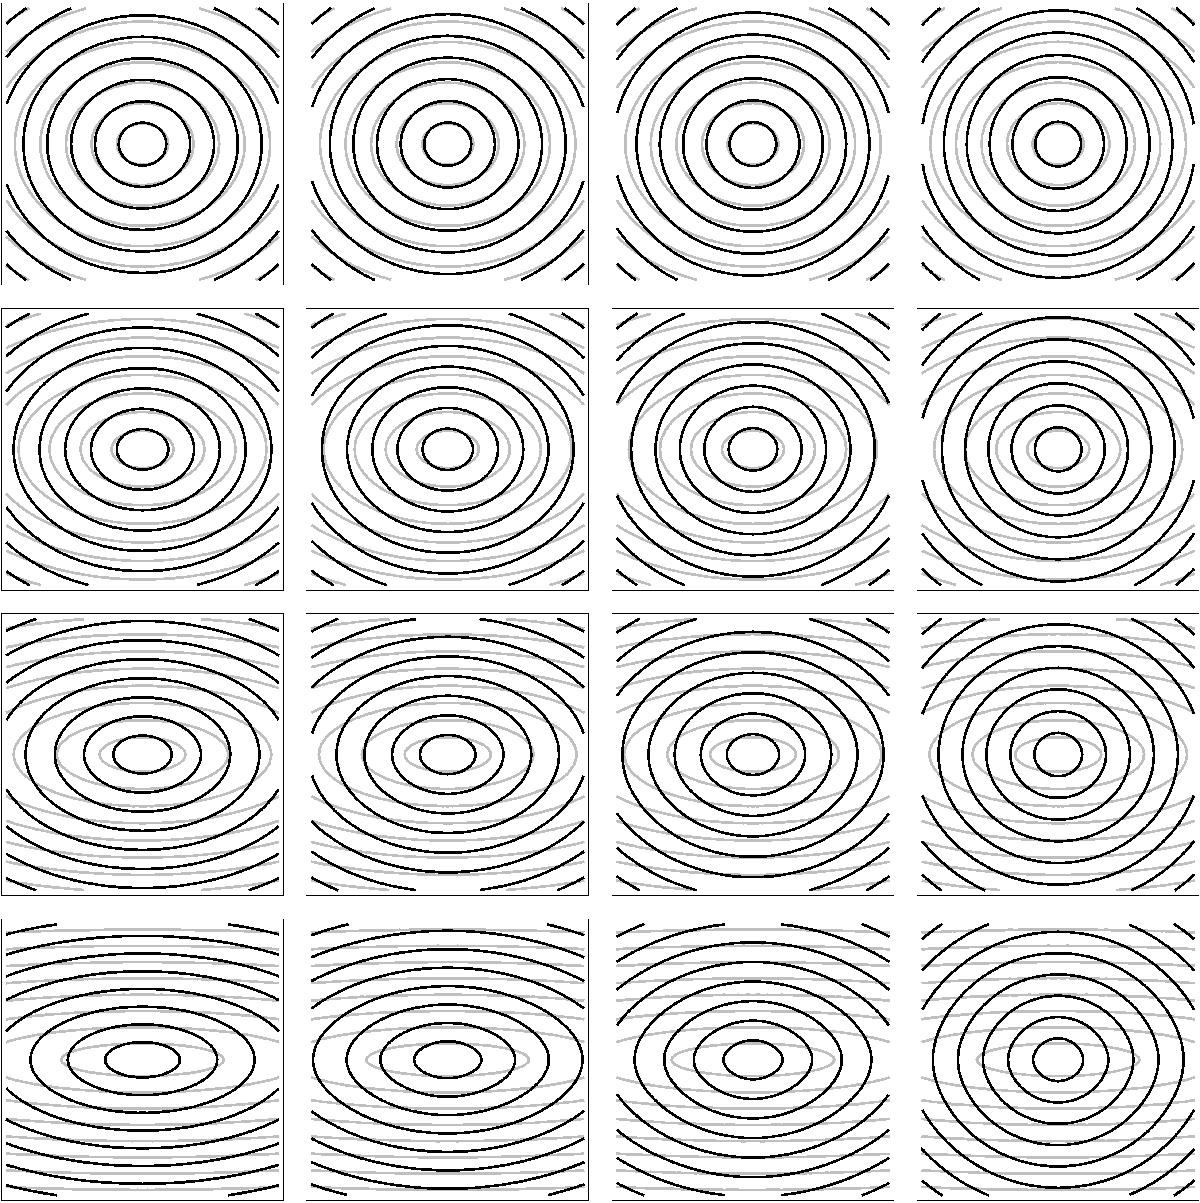
Isocontours of the deflection potential ψ (black) and surface mass density κ (grey) for an elliptical power law profile lens in physical coordinates x,y. For the purpose of illustration, the contour levels are equally spaced along the diagonals. The slope of the power law profile varies from t = 0.25 (left) to t = 1.75 (right) in steps of 0.5. The axis ratio varies from q = 0.8 (top) to q = 0.2 (bottom) in steps of 0.2.
Current usage metrics show cumulative count of Article Views (full-text article views including HTML views, PDF and ePub downloads, according to the available data) and Abstracts Views on Vision4Press platform.
Data correspond to usage on the plateform after 2015. The current usage metrics is available 48-96 hours after online publication and is updated daily on week days.
Initial download of the metrics may take a while.