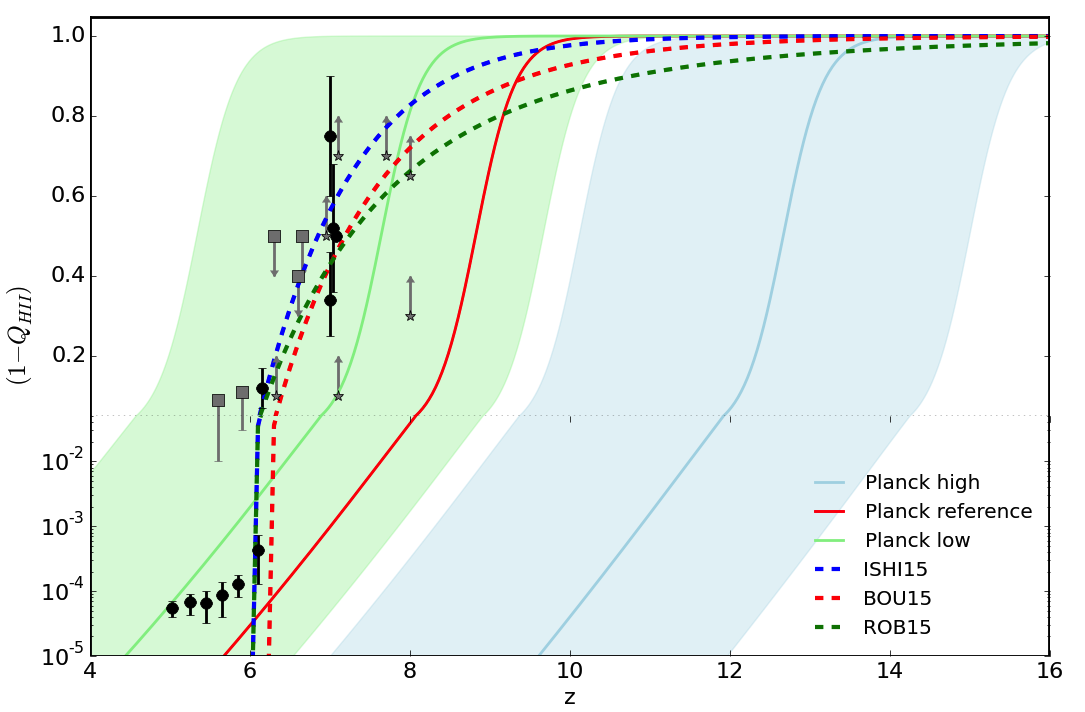
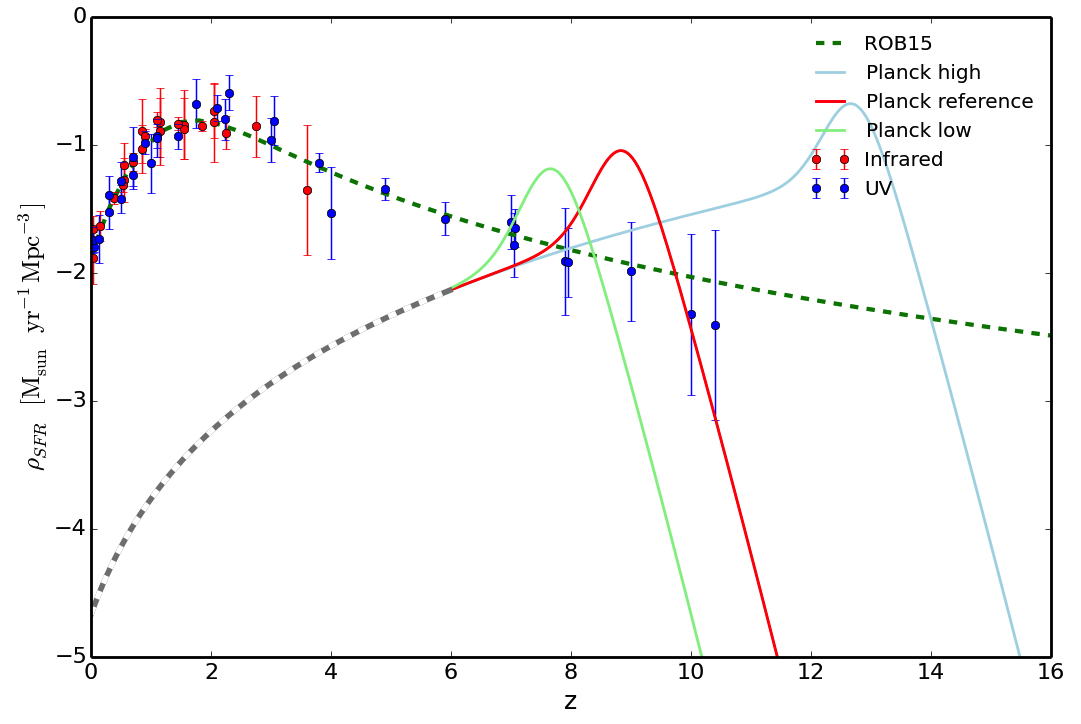
Fig. 1
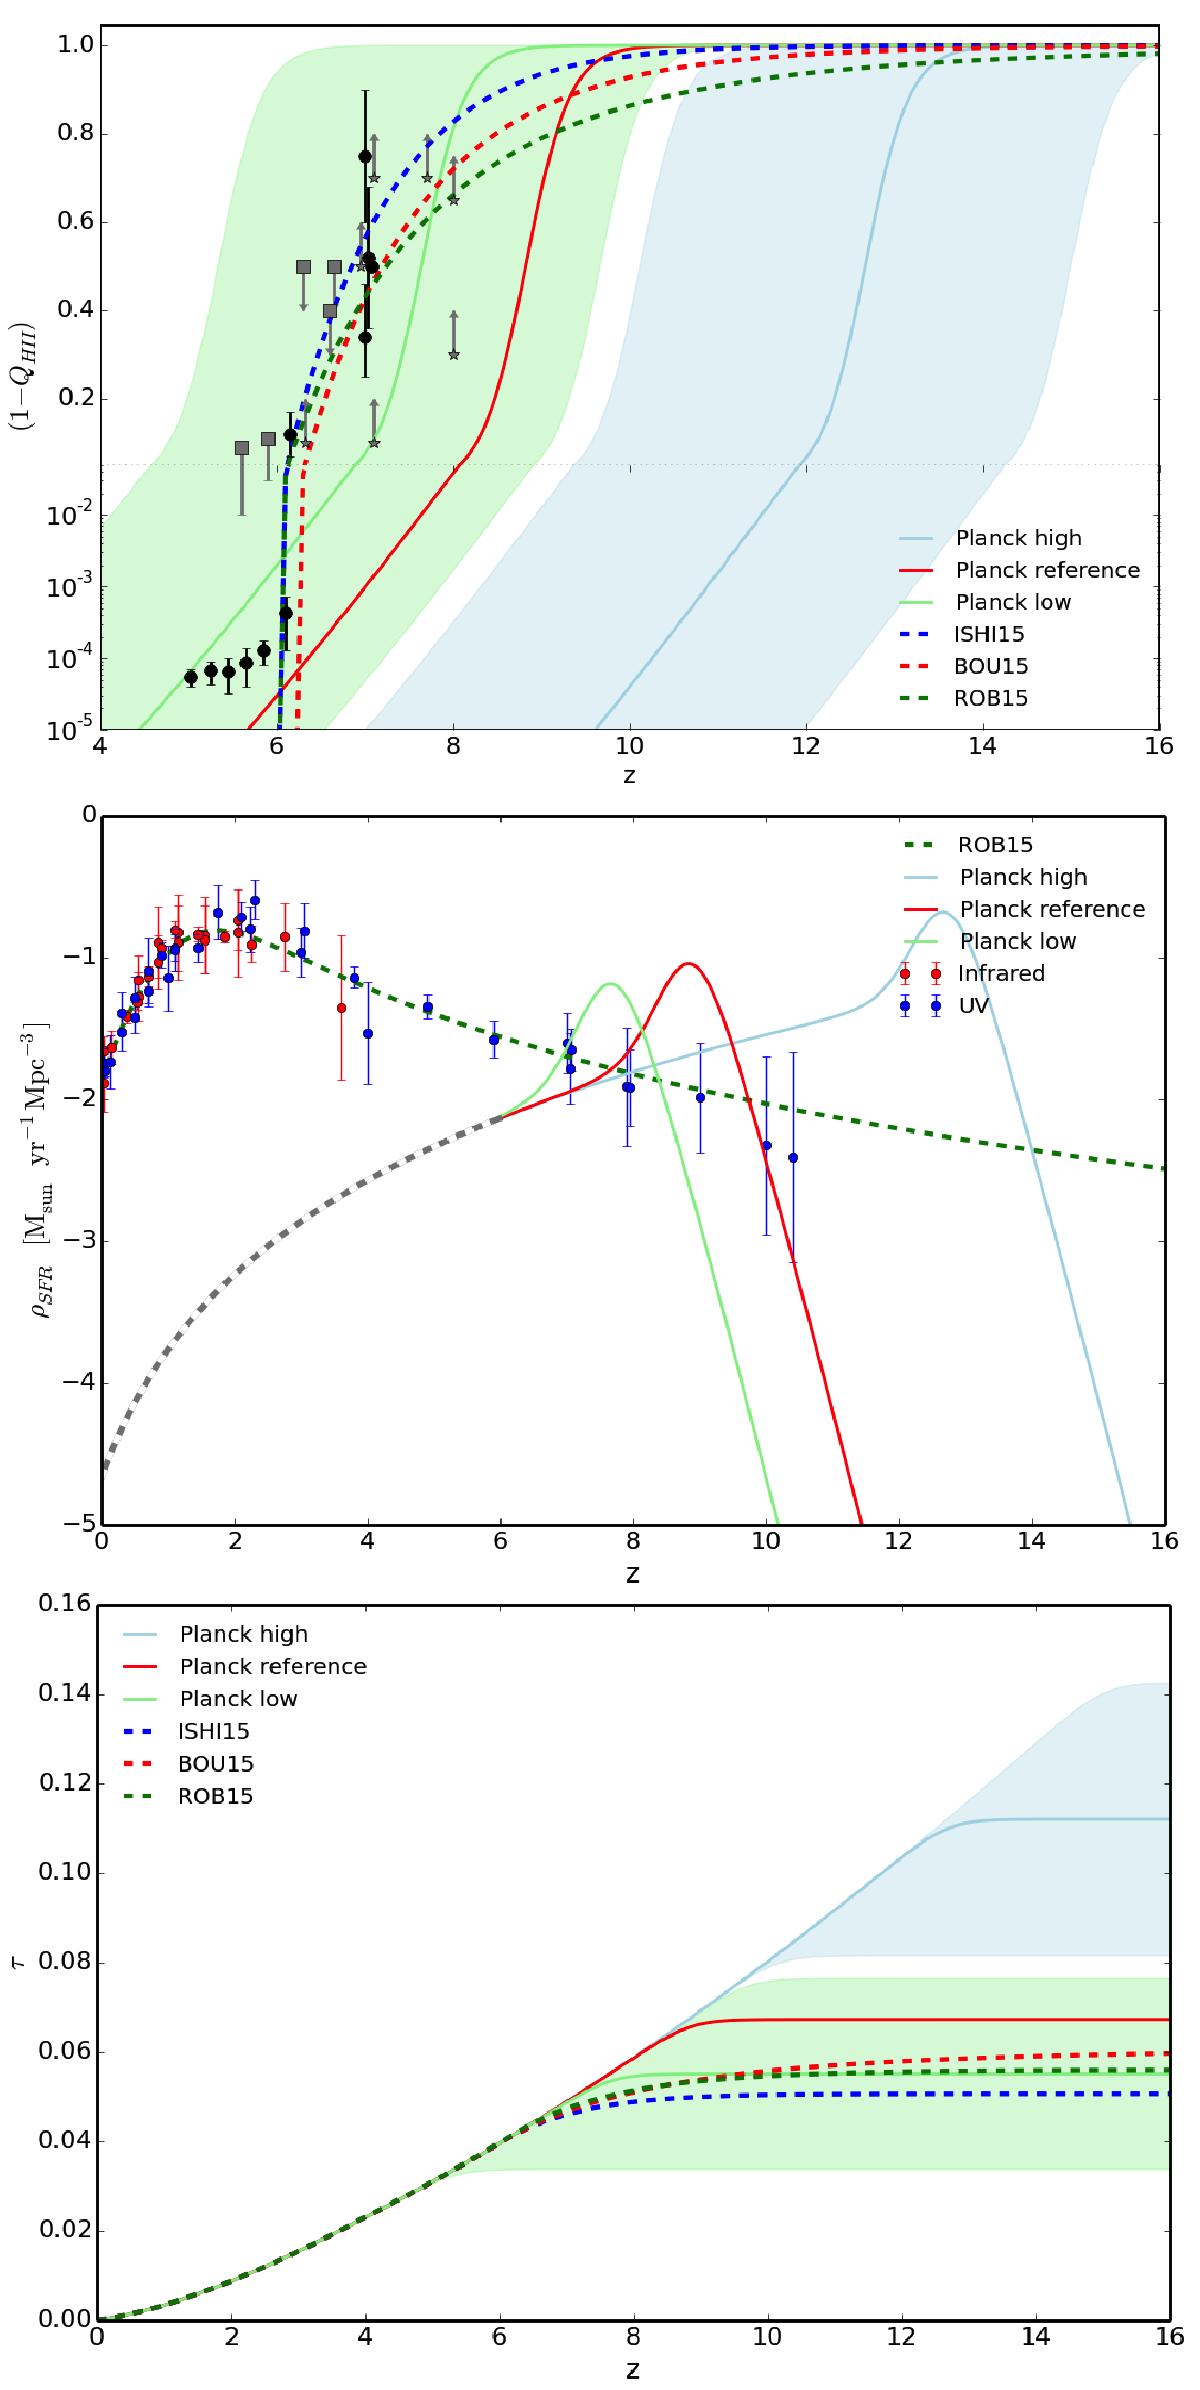
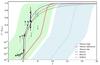
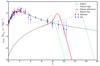
Upper panel: reionisation histories compared to low-redshift probes. Shaded envelopes show the low/high-τ values derived from Planck with uncertainties. The red line indicates the best Planck value τ = 0.66. Dashed lines are derived from the best ionisation rate (Ṅion) of ISHI15, ROB15, BOU15. Symbols are current constraints from direct line-of-sight measurements compiled by BOU15. Middle panel: corresponding ρSFR for Planck and the best fit of ROB15 with observational data compiled by ROB15. The grey dashed part corresponds to QHII ~ 1. Lower panel: evolution of the integrated optical depth for the different studies plotted in the upper panel.
Current usage metrics show cumulative count of Article Views (full-text article views including HTML views, PDF and ePub downloads, according to the available data) and Abstracts Views on Vision4Press platform.
Data correspond to usage on the plateform after 2015. The current usage metrics is available 48-96 hours after online publication and is updated daily on week days.
Initial download of the metrics may take a while.