Fig. 7
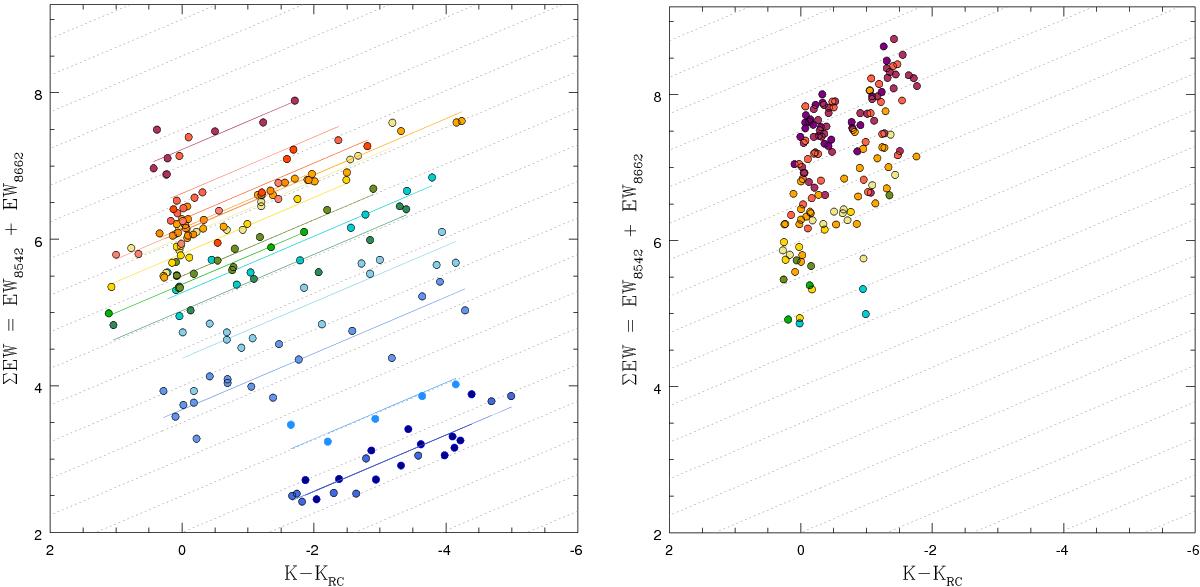
CaT equivalent widths of the star cluster RGBs (left panel) and Galactic bulge stars (right panel) are compared with their corresponding magnitude above the mean red clump magnitude. The colour code is used to mark clusters of different metallicity, together with their best-fitting lines, assuming the best common slope of 0.384 Å mag-1. The thin dotted lines in each panel show this slope to guide the eye.
Current usage metrics show cumulative count of Article Views (full-text article views including HTML views, PDF and ePub downloads, according to the available data) and Abstracts Views on Vision4Press platform.
Data correspond to usage on the plateform after 2015. The current usage metrics is available 48-96 hours after online publication and is updated daily on week days.
Initial download of the metrics may take a while.