Free Access
Fig. 4
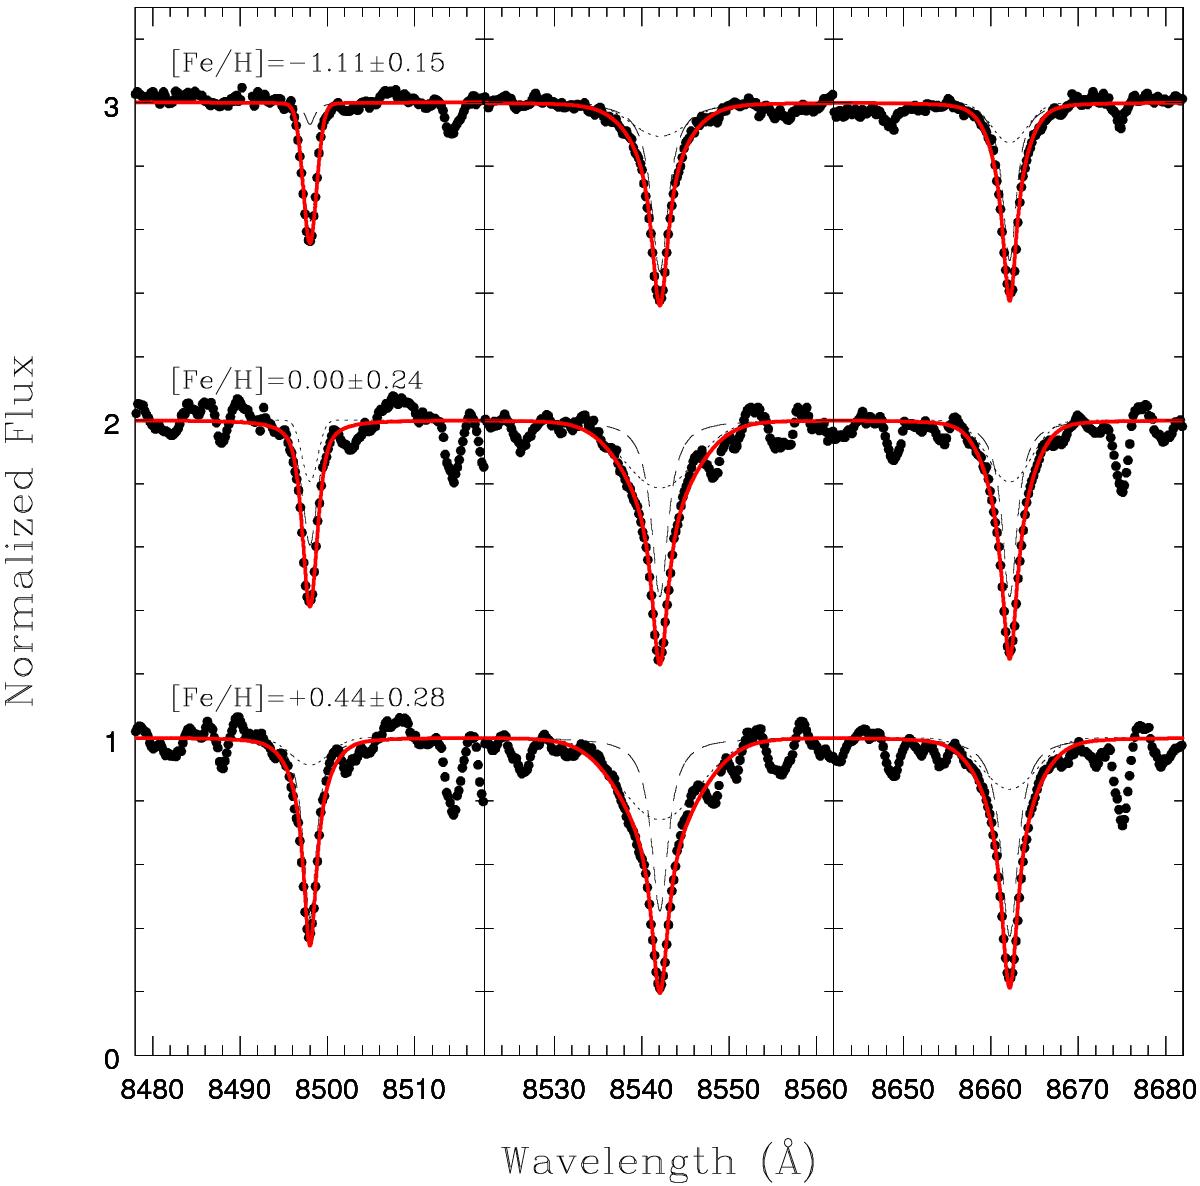
Fitting examples for three bulge stars covering the metallicity range of the Milky Way bulge. The red line corresponds to the best-fitting function found for each line, while we plot the individual contribution from Gaussian and Lorentzian functions as dashed lines.
Current usage metrics show cumulative count of Article Views (full-text article views including HTML views, PDF and ePub downloads, according to the available data) and Abstracts Views on Vision4Press platform.
Data correspond to usage on the plateform after 2015. The current usage metrics is available 48-96 hours after online publication and is updated daily on week days.
Initial download of the metrics may take a while.