Fig. 3
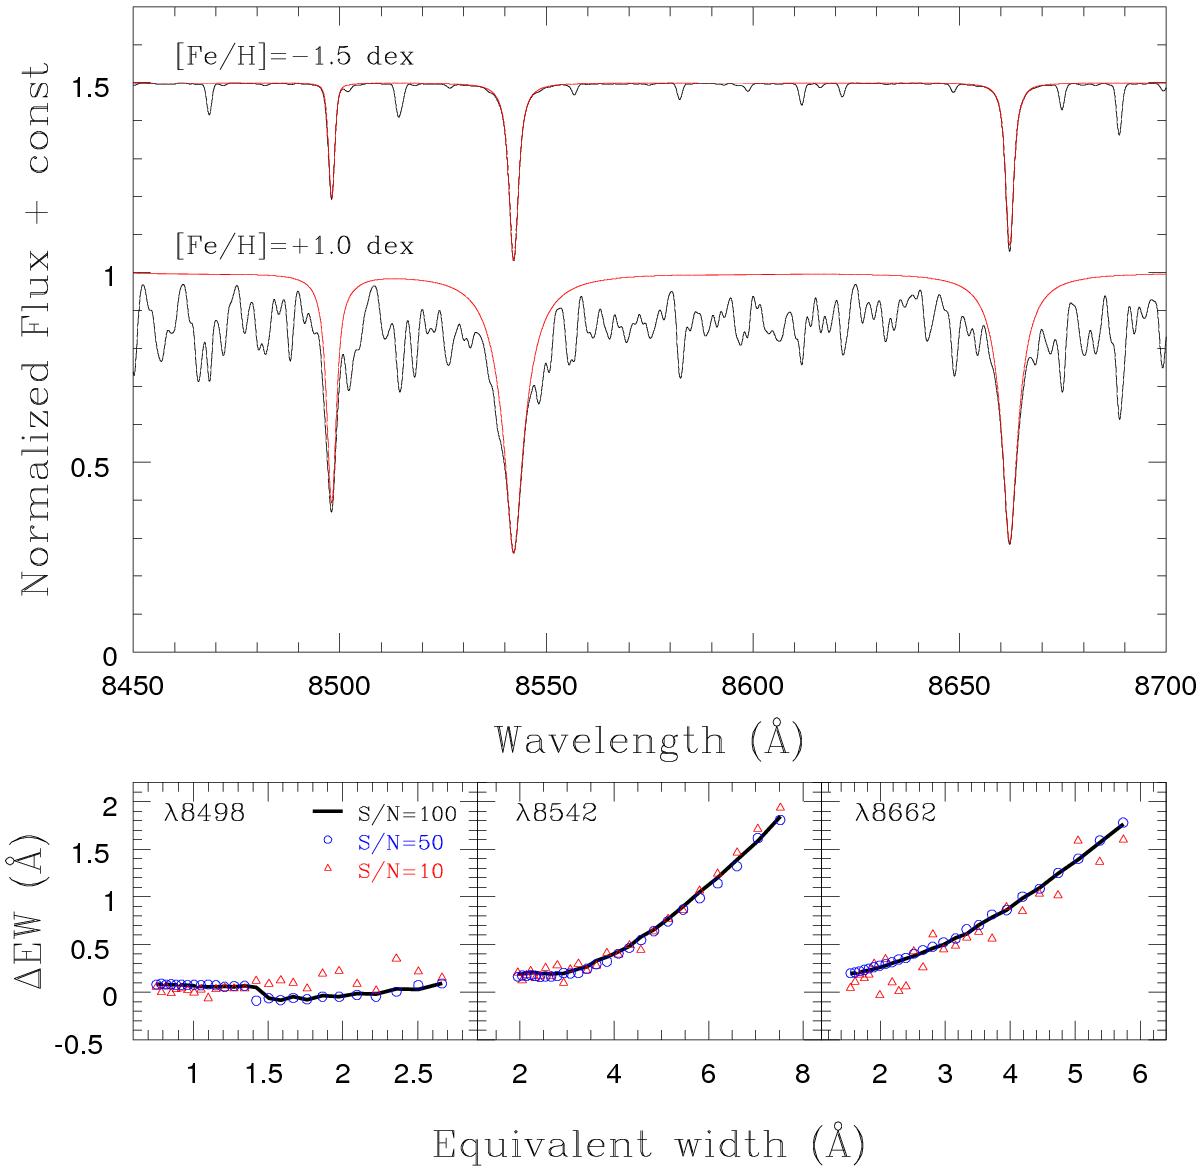
Upper panel: comparison between the more metal poor and metal rich synthetic spectra from our library, in the region around the CaT lines. In both cases, the black line shows the spectra including the lines of all elements, while the red lines shows only the three CaT lines. The lower panels show the difference between the real EW, as measured in the red spectra, and the measured EW, as measured in the black spectra, for each of the three CaT lines as a function of EW and for three values of S/N.
Current usage metrics show cumulative count of Article Views (full-text article views including HTML views, PDF and ePub downloads, according to the available data) and Abstracts Views on Vision4Press platform.
Data correspond to usage on the plateform after 2015. The current usage metrics is available 48-96 hours after online publication and is updated daily on week days.
Initial download of the metrics may take a while.