Fig. 2
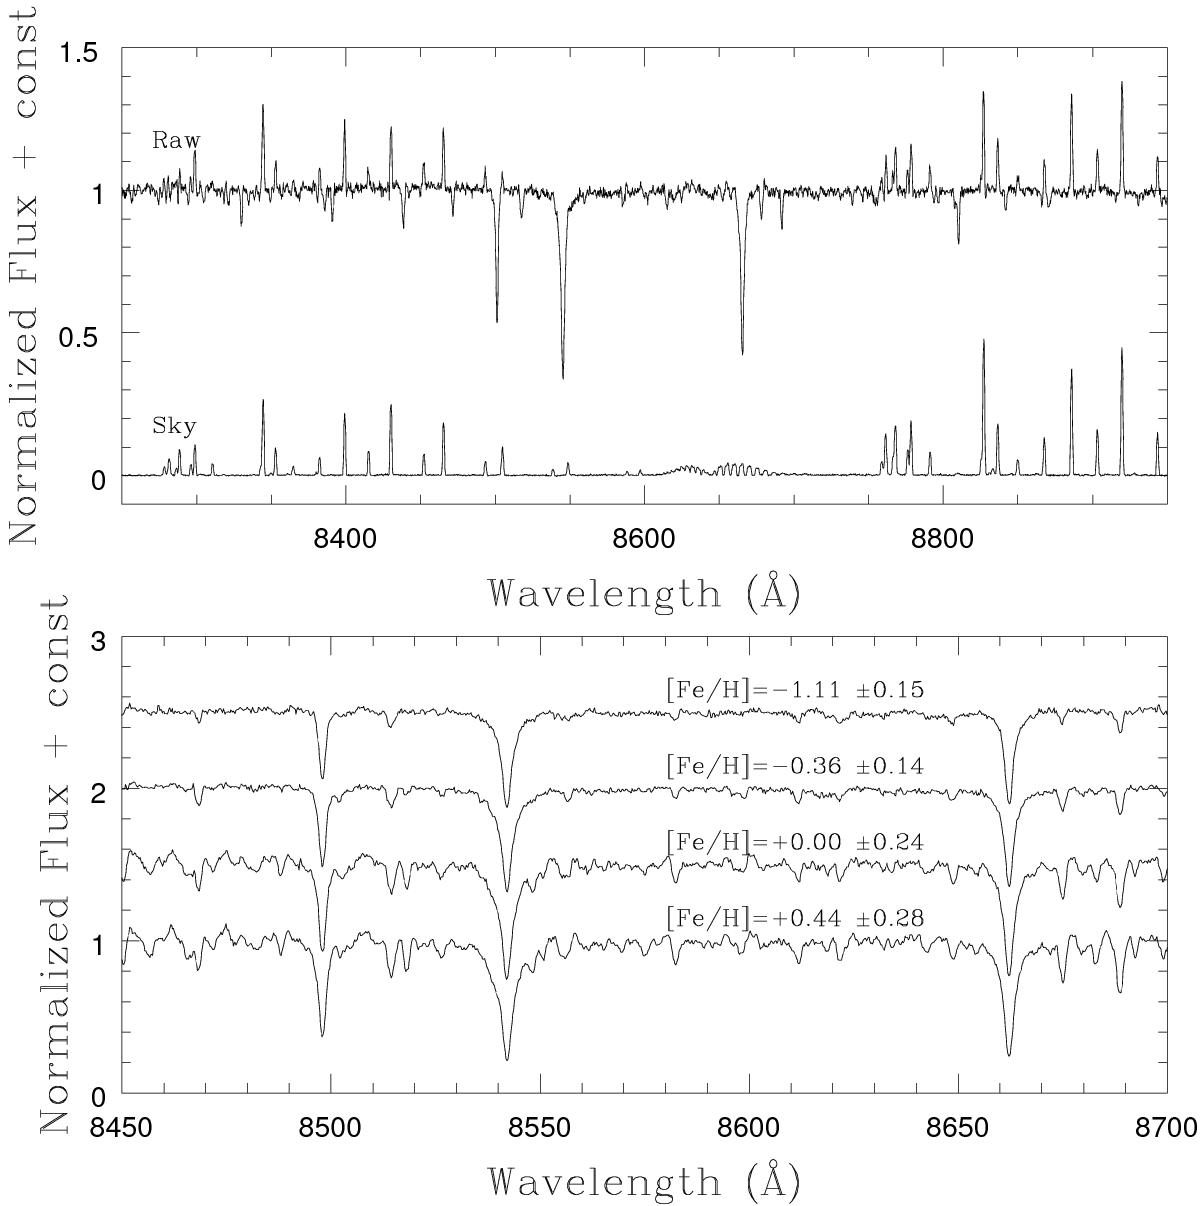
Upper panel: normalised raw spectrum for a typical Milky Way bulge star together with the corresponding sky spectrum. The lower panel shows processed spectra for four bulge stars spanning the typical metallicity range of the Galactic bulge. The increasing strength of the CaT lines with metallicity is evident, as is the increasing number of small atomic lines contaminating the continuum.
Current usage metrics show cumulative count of Article Views (full-text article views including HTML views, PDF and ePub downloads, according to the available data) and Abstracts Views on Vision4Press platform.
Data correspond to usage on the plateform after 2015. The current usage metrics is available 48-96 hours after online publication and is updated daily on week days.
Initial download of the metrics may take a while.