Fig. 3
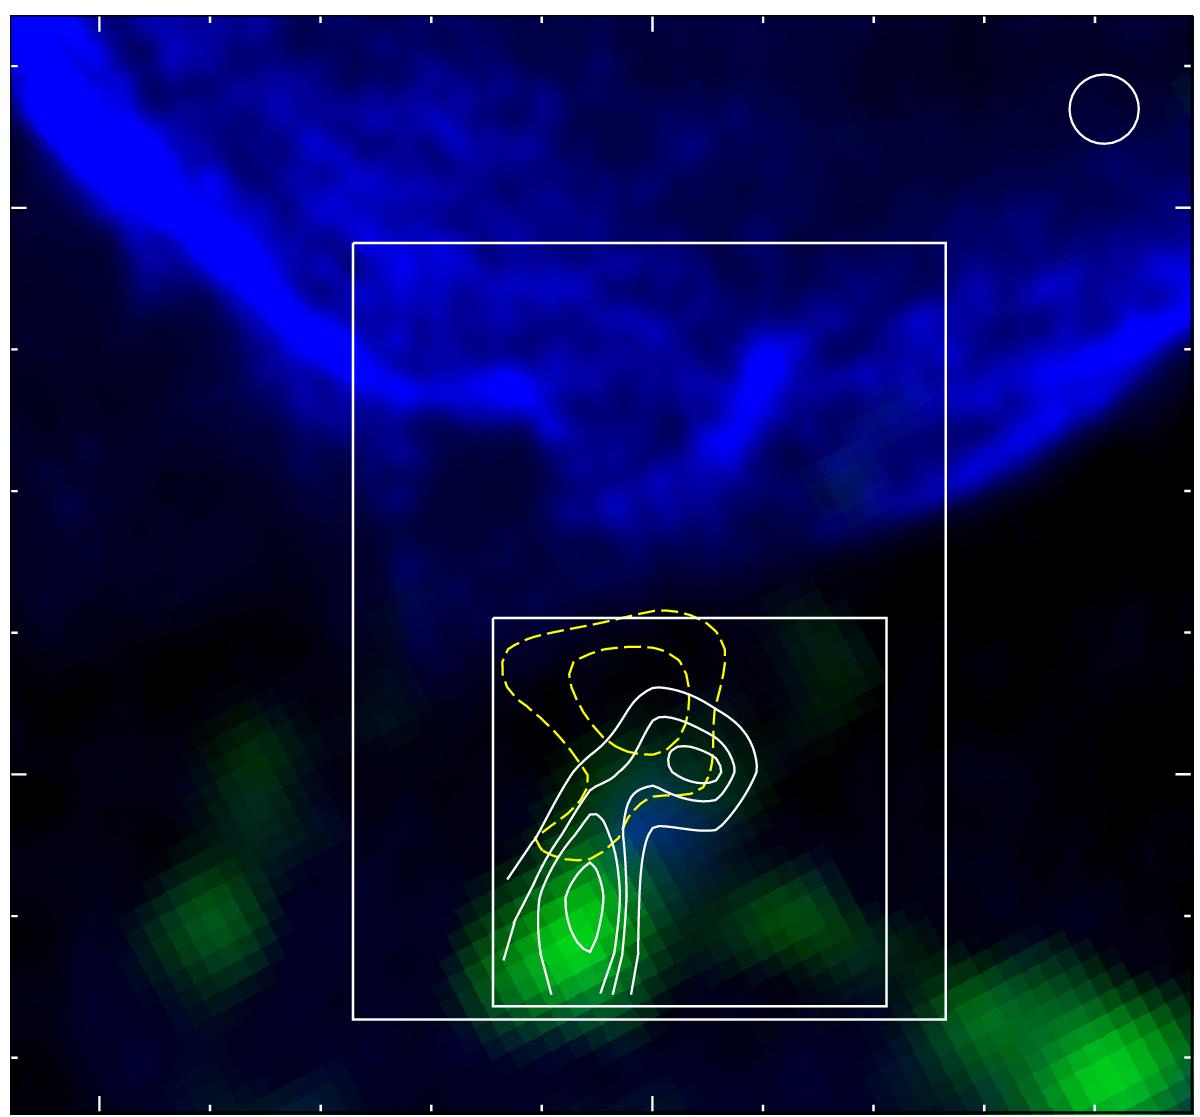
Two-color image toward Reg. 1b with the radio continuum emission at 20 cm (from MAGPIS) displayed in blue and the ATLASGAL emission at 870 μm in green. The color ranges are the same as in Fig. 2. For context, the box of Reg. 1 and the 56, and 68 K km s-1 contours (in dashed yellow line) of the 12CO emission presented in Fig. 2 are also shown. Contours of the 13CO J = 3−2 emission integrated between 15 and 26 km s-1 are shown in white, with levels of 12.0, 15.0, 16.5, and 20.0 K km s-1. The beam of the molecular observations is shown in the top right corner.
Current usage metrics show cumulative count of Article Views (full-text article views including HTML views, PDF and ePub downloads, according to the available data) and Abstracts Views on Vision4Press platform.
Data correspond to usage on the plateform after 2015. The current usage metrics is available 48-96 hours after online publication and is updated daily on week days.
Initial download of the metrics may take a while.