Free Access
Fig. 1
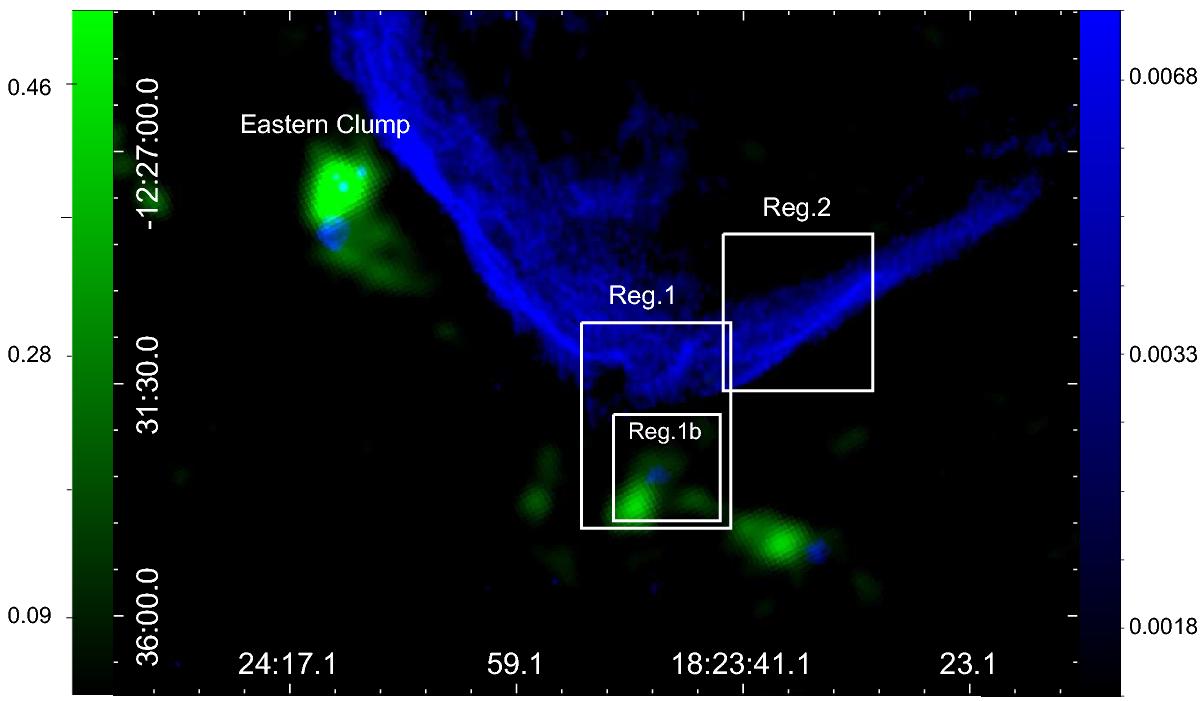
Two-color image of the SNR G18.8+0.3 and its surroundings. The radio continuum emission at 20 cm (from MAGPIS) is displayed in blue (right color bar) and the ATLASGAL emission at 870 μm in green (left color bar). Both color ranges are in Jy beam-1. The surveyed regions in the molecular lines using ASTE are indicated.
Current usage metrics show cumulative count of Article Views (full-text article views including HTML views, PDF and ePub downloads, according to the available data) and Abstracts Views on Vision4Press platform.
Data correspond to usage on the plateform after 2015. The current usage metrics is available 48-96 hours after online publication and is updated daily on week days.
Initial download of the metrics may take a while.