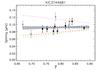
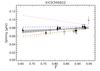
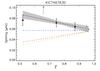
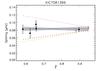
Fig. 7
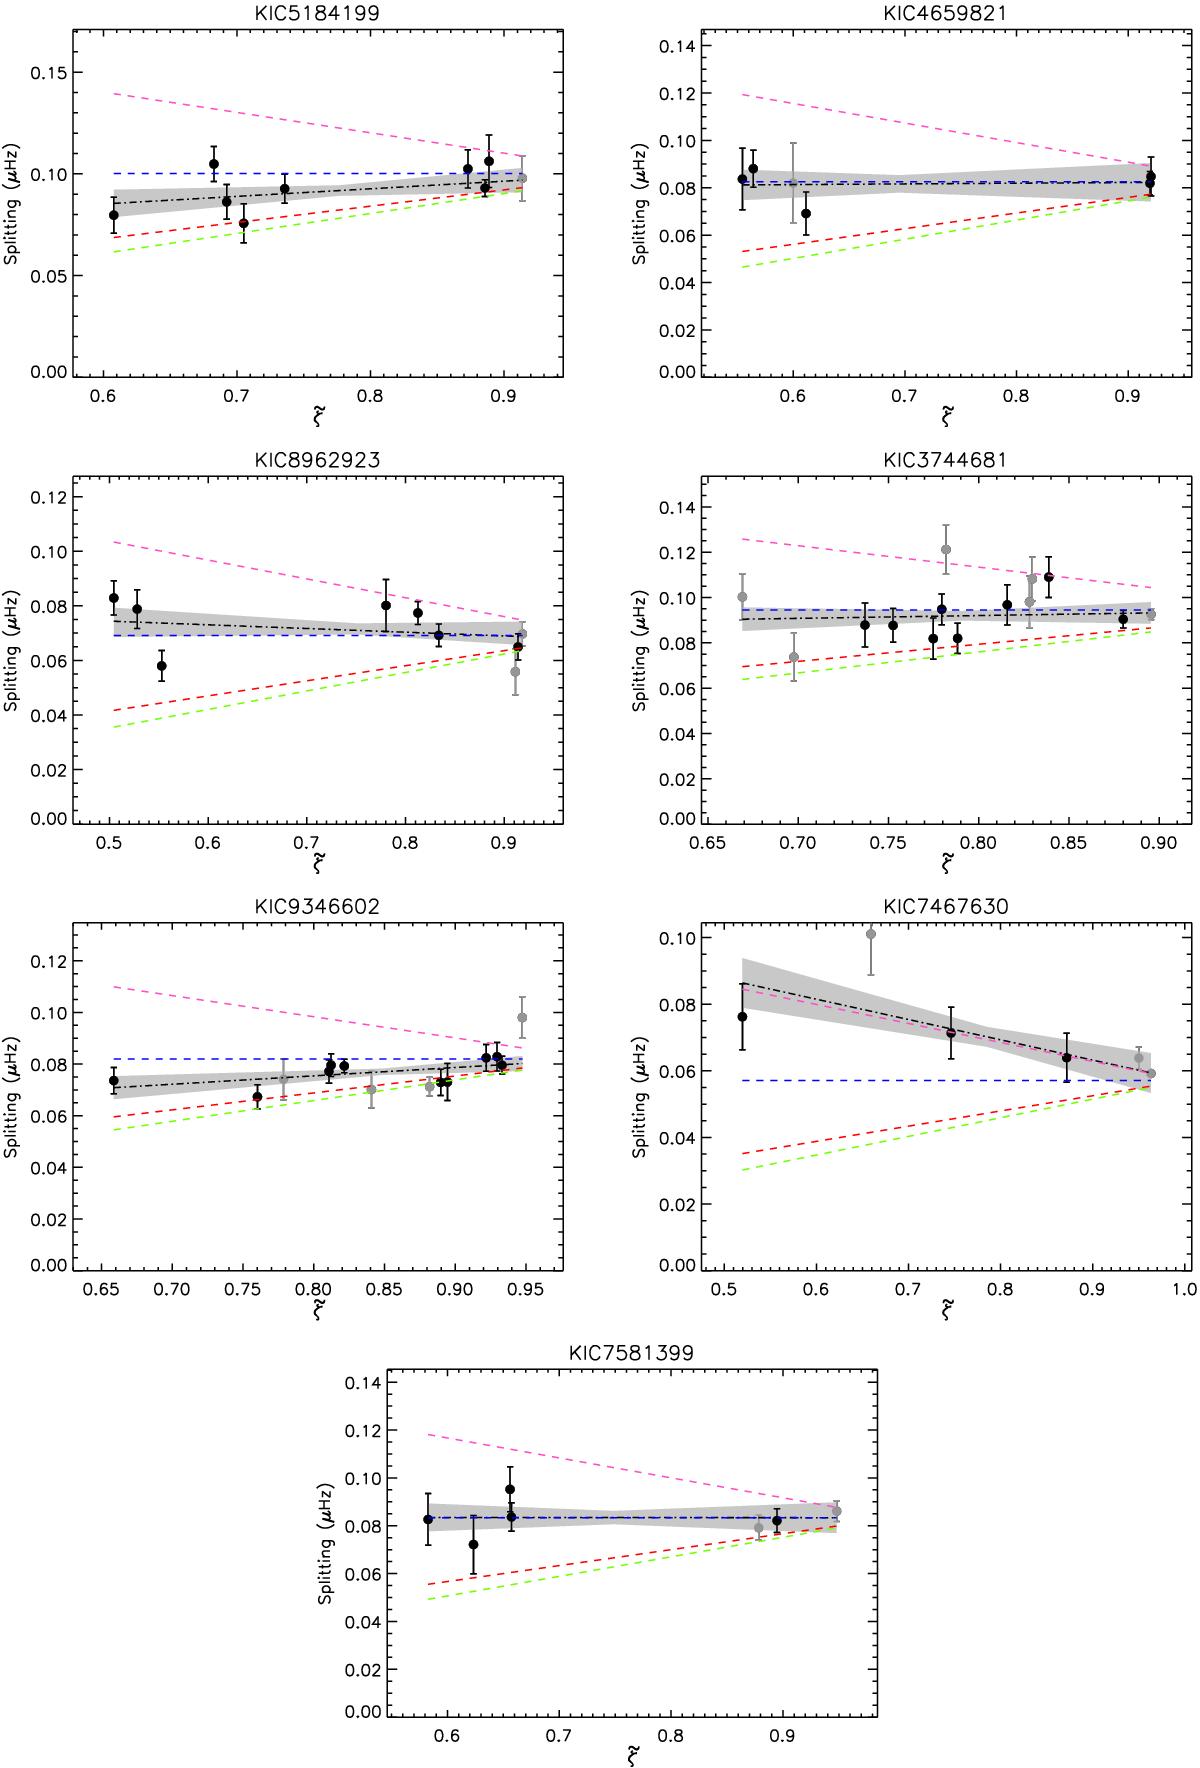
Rotational splittings as a function of the parameter ![]() which is an estimate of the mode trapping (see text). The circles correspond to the observed splittings (black symbols indicate modes that passed both frequentist and Bayesian significance tests and gray symbols modes that passed the frequentist test only). The black dot-dashed line shows a linear regression of the observed splittings as a function of
which is an estimate of the mode trapping (see text). The circles correspond to the observed splittings (black symbols indicate modes that passed both frequentist and Bayesian significance tests and gray symbols modes that passed the frequentist test only). The black dot-dashed line shows a linear regression of the observed splittings as a function of ![]() and the gray shaded area indicates the uncertainties on the regression parameters. The dashed lines indicate theoretical splittings for 2-zone models that reproduce the observed rotation in the g-mode cavity and with Ωcore/ Ωsurf of 1, 2, 10, or 100 from top to bottom (same colors as in Fig. 4).
and the gray shaded area indicates the uncertainties on the regression parameters. The dashed lines indicate theoretical splittings for 2-zone models that reproduce the observed rotation in the g-mode cavity and with Ωcore/ Ωsurf of 1, 2, 10, or 100 from top to bottom (same colors as in Fig. 4).
Current usage metrics show cumulative count of Article Views (full-text article views including HTML views, PDF and ePub downloads, according to the available data) and Abstracts Views on Vision4Press platform.
Data correspond to usage on the plateform after 2015. The current usage metrics is available 48-96 hours after online publication and is updated daily on week days.
Initial download of the metrics may take a while.