Free Access
Fig. 3
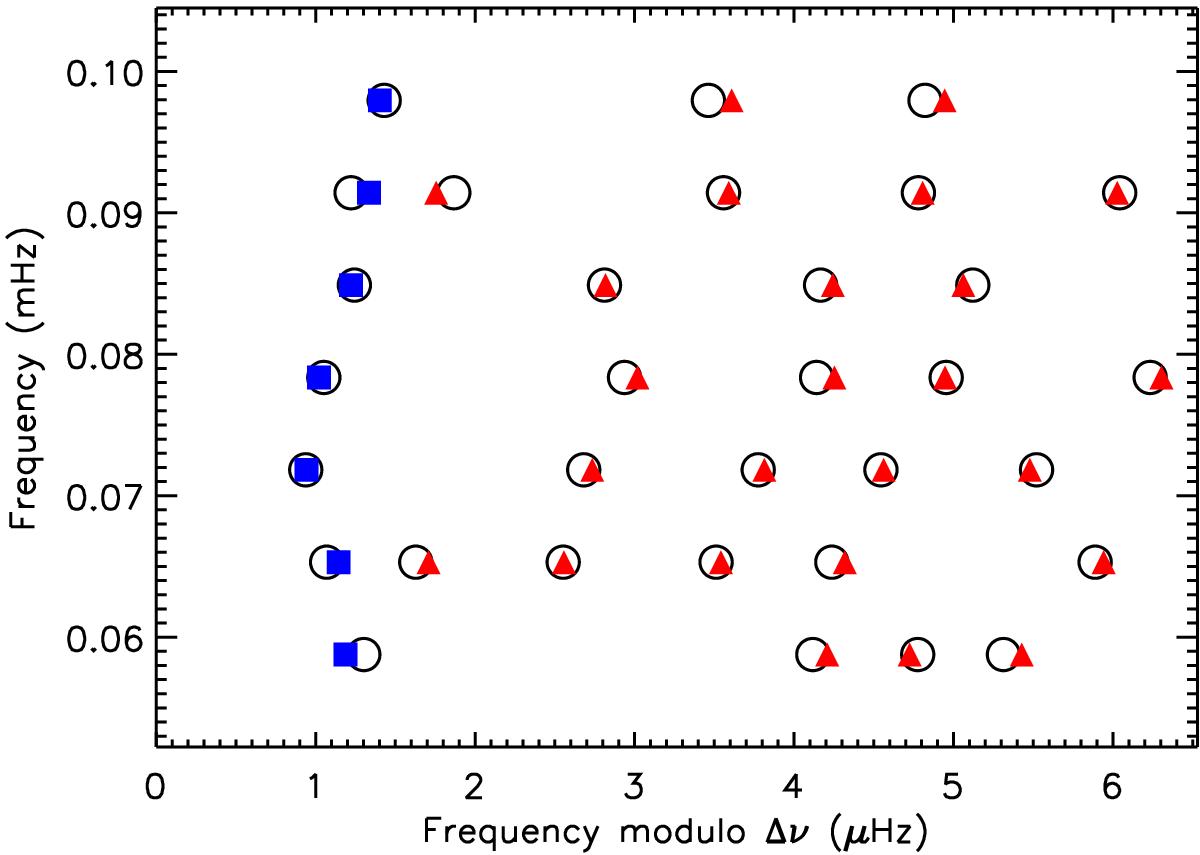
Échelle diagram of the best-fit model for KIC7581399. The open circles correspond to the observed frequencies and the colored filled symbols represent those of the model (blue squares: l = 0 modes, red triangles: l = 1 modes).
Current usage metrics show cumulative count of Article Views (full-text article views including HTML views, PDF and ePub downloads, according to the available data) and Abstracts Views on Vision4Press platform.
Data correspond to usage on the plateform after 2015. The current usage metrics is available 48-96 hours after online publication and is updated daily on week days.
Initial download of the metrics may take a while.