Fig. 6
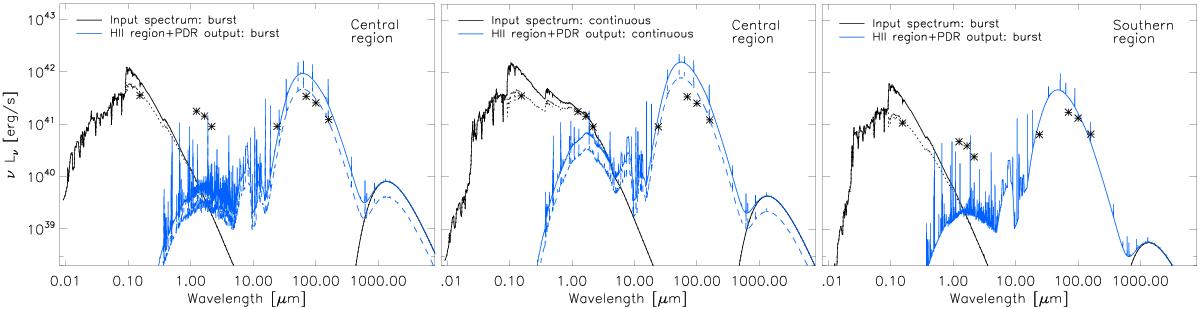
Spectral energy distributions of the two star-forming regions: central region single-burst case (left panel), central region continuous case (middle panel), and southern region single-burst model (right panel). The black and blue curves correspond to the input and output SEDs, respectively. The dotted lines are the attenuated input SEDs. The data points are the photometry measurements from GALEX FUV, 2MASS J, H, K bands, MIPS 24 μm, and PACS at 70 μm, 100 μm, and 160 μm. In panels for the central region, the dashed curves are scaled versions of the output SEDs, considering a covering factor of 0.5 for the PDR.
Current usage metrics show cumulative count of Article Views (full-text article views including HTML views, PDF and ePub downloads, according to the available data) and Abstracts Views on Vision4Press platform.
Data correspond to usage on the plateform after 2015. The current usage metrics is available 48-96 hours after online publication and is updated daily on week days.
Initial download of the metrics may take a while.