Fig. 5
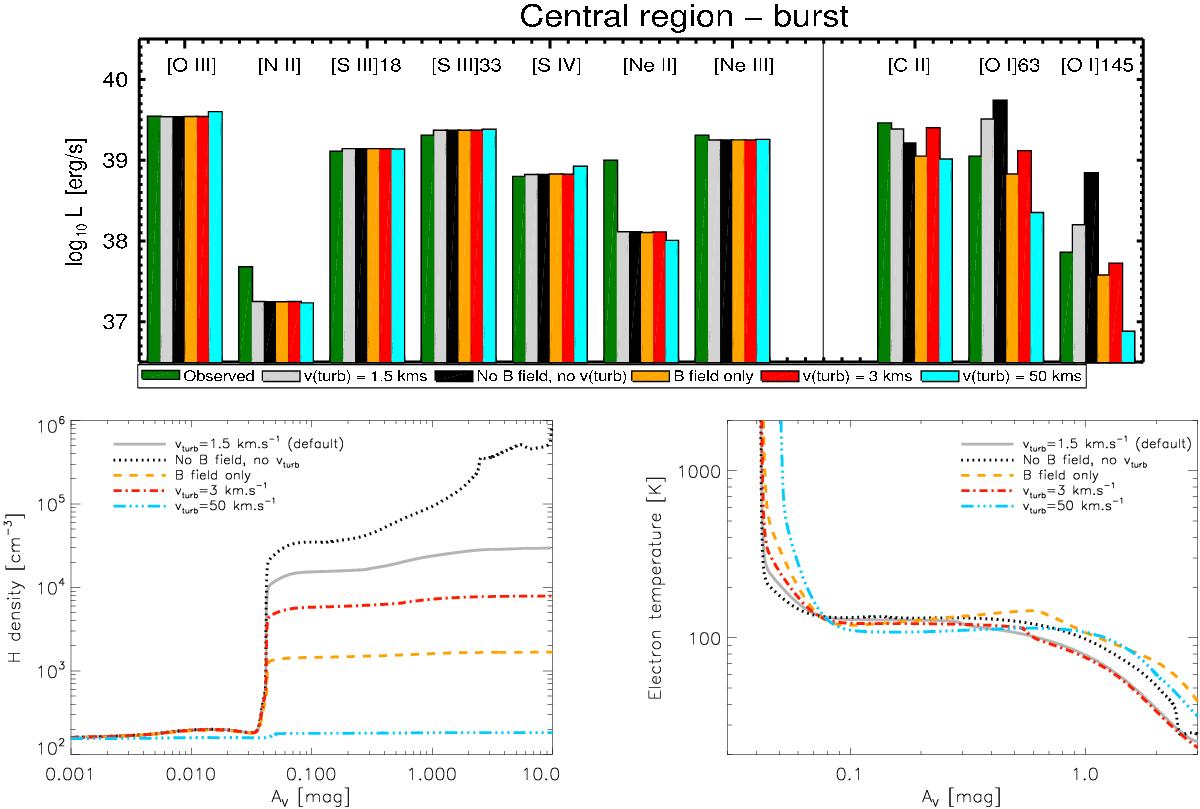
Effect of turbulence and magnetic fields on the predicted line intensities (top panel), density, and temperature (bottom panels) in the modeled cloud for the central region single-burst case. Green bars: observations. Gray bars and solid lines: only low turbulence switched on (vturb = 1.5 km s-1, default model). Black bars and dotted lines: no magnetic fields and no turbulence. Orange bars and dashed lines: only magnetic field switched on (B = 30 μG). Red bars and dash-dotted line: only moderate turbulence switched on (vturb = 3 km s-1). Cyan bars and triple-dotted-dashed line: only high turbulence switched on (vturb = 50 km s-1).
Current usage metrics show cumulative count of Article Views (full-text article views including HTML views, PDF and ePub downloads, according to the available data) and Abstracts Views on Vision4Press platform.
Data correspond to usage on the plateform after 2015. The current usage metrics is available 48-96 hours after online publication and is updated daily on week days.
Initial download of the metrics may take a while.