Free Access
Fig. 4
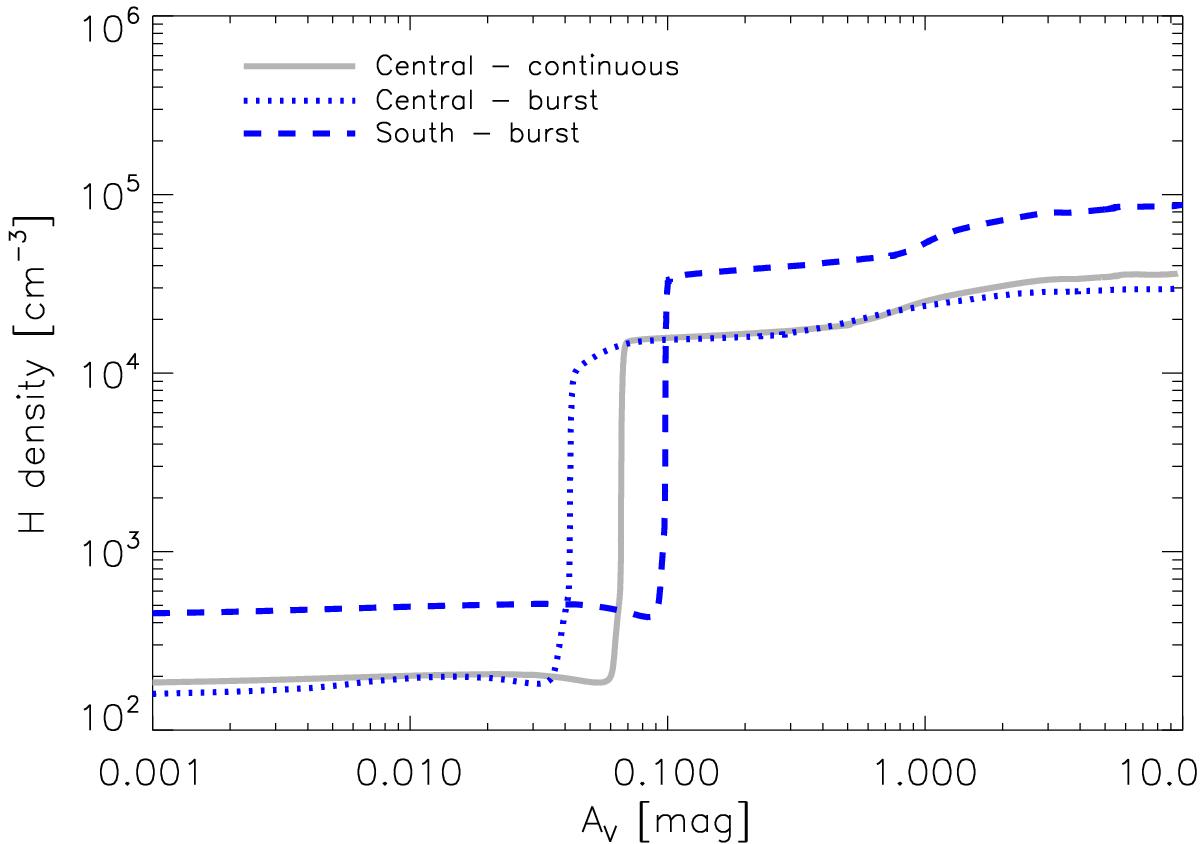
Density profiles in the modeled clouds for the central and southern region, which include a turbulence pressure term (vturb = 1.5 km s-1). Note that the x-axis is logarithmic, so the H ii region (with a constant low density) occupies a thin layer of the cloud, stopping at low visual extinction (~0.1 mag).
Current usage metrics show cumulative count of Article Views (full-text article views including HTML views, PDF and ePub downloads, according to the available data) and Abstracts Views on Vision4Press platform.
Data correspond to usage on the plateform after 2015. The current usage metrics is available 48-96 hours after online publication and is updated daily on week days.
Initial download of the metrics may take a while.