Fig. 3
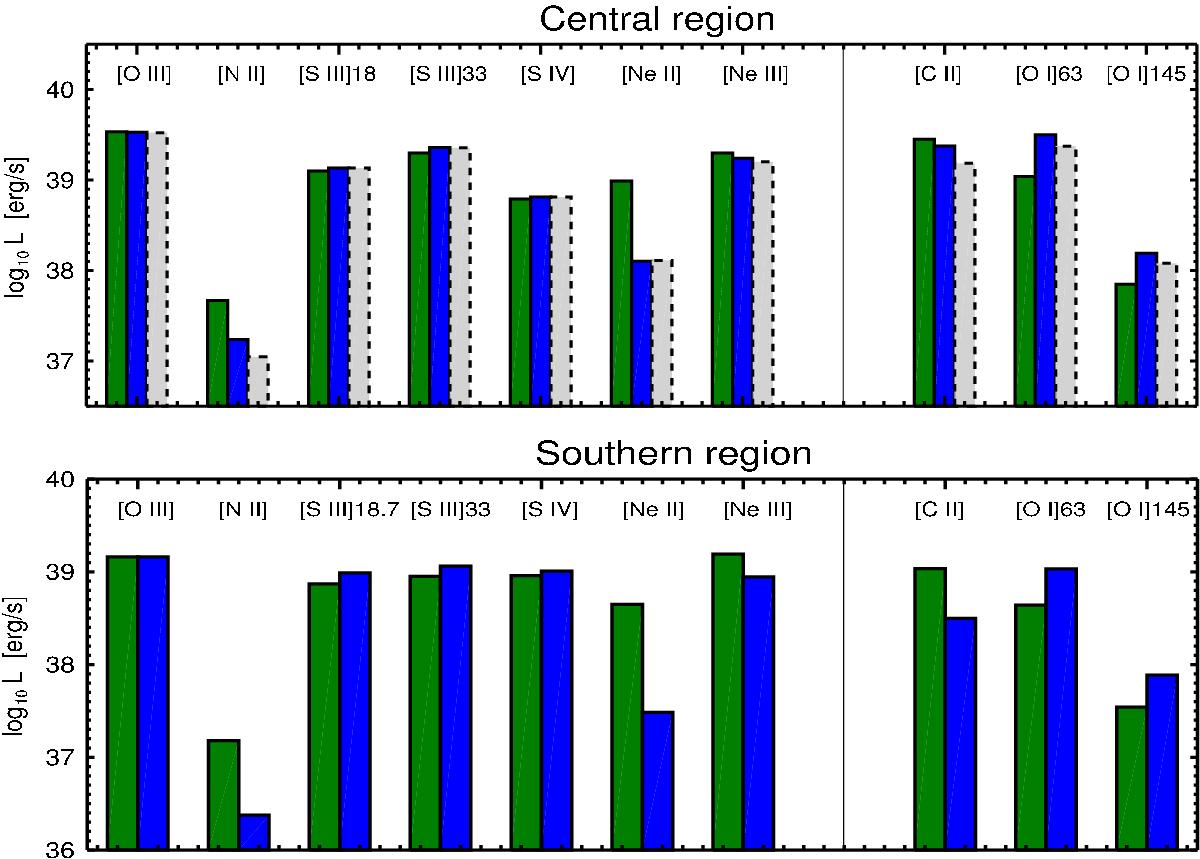
Results for the central region (top panel) and for the southern region (bottom panel): line emission for the H ii region (left side) and the PDR (right side), assuming pressure equilibrium. Green bars represent the observations, blue bars our single-burst model predictions, and gray bars with a dashed outline the continuous star formation model predictions.
Current usage metrics show cumulative count of Article Views (full-text article views including HTML views, PDF and ePub downloads, according to the available data) and Abstracts Views on Vision4Press platform.
Data correspond to usage on the plateform after 2015. The current usage metrics is available 48-96 hours after online publication and is updated daily on week days.
Initial download of the metrics may take a while.