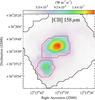
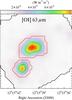
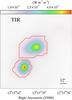
Fig. 2
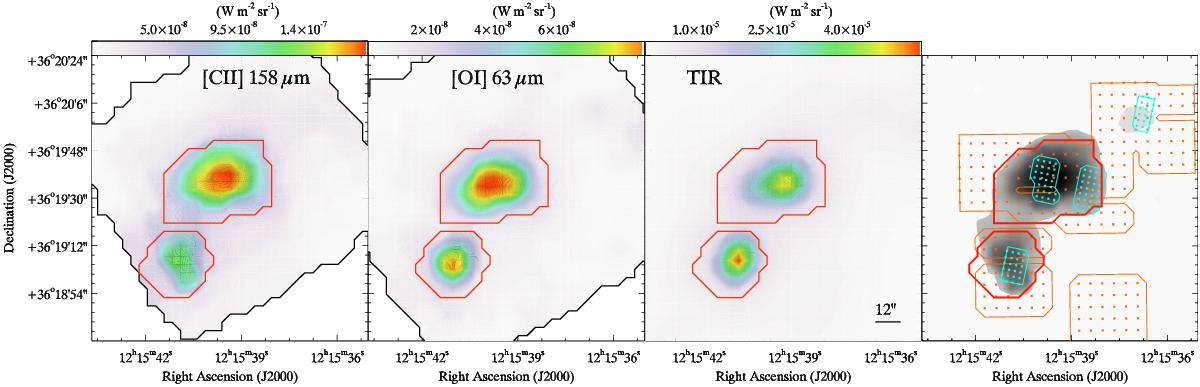
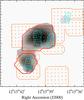
Maps of the [C ii] 157 μm, [O i] 63 μm, and TIR emission in NGC 4214. Units are W m-2 sr-1. The two star-forming regions, as defined in Sect. 2.4, are outlined with red contours. The right panel shows the Spitzer IRS mapping strategy. Orange: Long-High module coverage; cyan: Short-High module coverage; gray background: [C ii] 157 μm map.
Current usage metrics show cumulative count of Article Views (full-text article views including HTML views, PDF and ePub downloads, according to the available data) and Abstracts Views on Vision4Press platform.
Data correspond to usage on the plateform after 2015. The current usage metrics is available 48-96 hours after online publication and is updated daily on week days.
Initial download of the metrics may take a while.