Free Access
Fig. 1
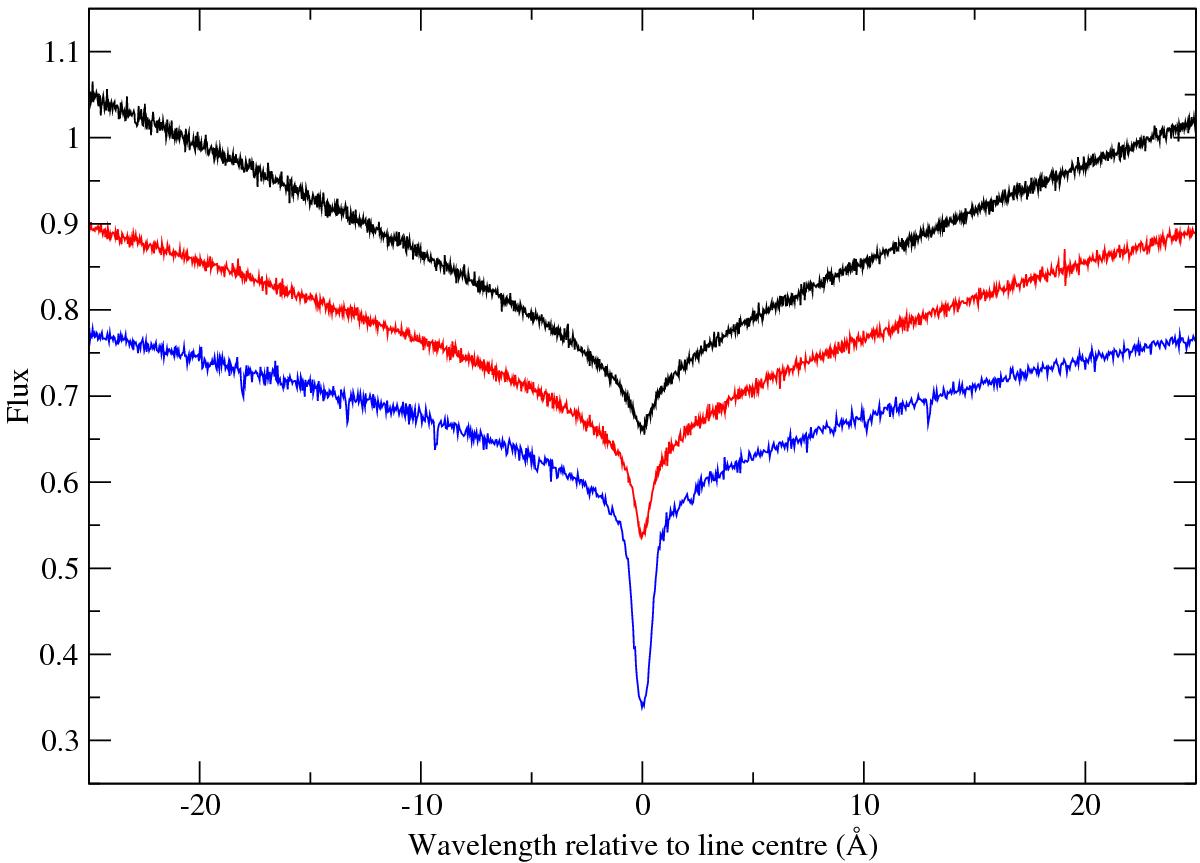
Balmer lines Hα (bottom), Hβ (middle), Hγ (top) from a typical ESPaDOnS spectrum of 40 Eri B. The continua for all lines are normalised to 1.0 in the far wings. The upper two spectra have been shifted upward for clarity by 0.2 (Hβ) and 0.3 (Hγ). The unique shape of the core of Hα is clear from this figure.
Current usage metrics show cumulative count of Article Views (full-text article views including HTML views, PDF and ePub downloads, according to the available data) and Abstracts Views on Vision4Press platform.
Data correspond to usage on the plateform after 2015. The current usage metrics is available 48-96 hours after online publication and is updated daily on week days.
Initial download of the metrics may take a while.