Fig. 6
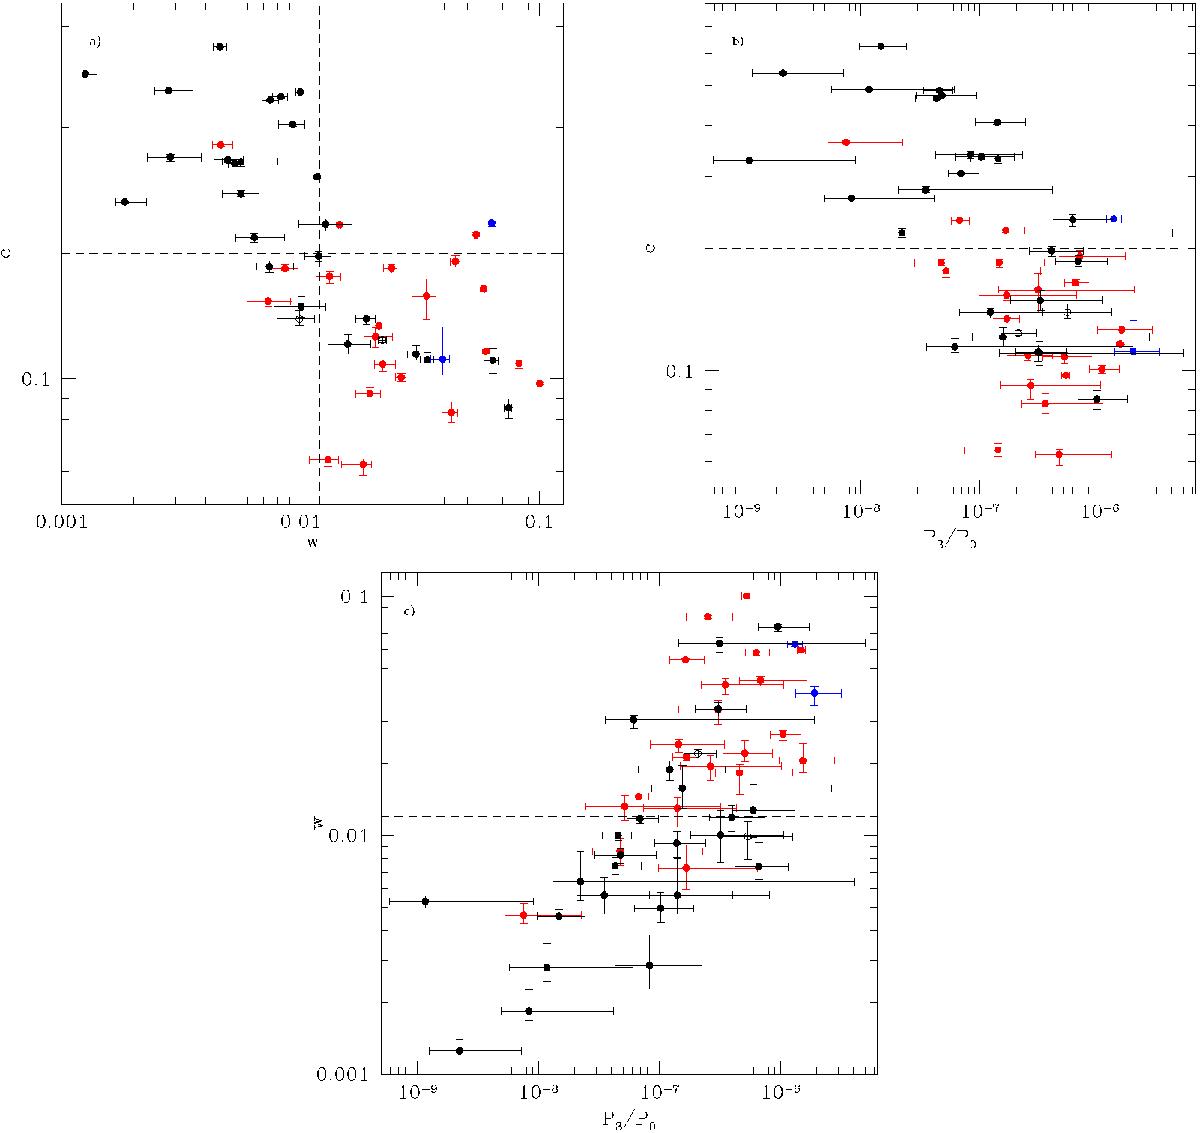
a)c−w; b) c−P3/P0; c) w−P3/P0 diagrams. Vertical and horizontal dashed lines: c = 0.2, w = 0.012, and P3/P0 = 1.2 × 10⁻⁷. Red, black, and blue dots represent clusters with RH, clusters without RH, and clusters hosting relics (without RHs), respectively. Black open dots are clusters with suspect diffuse emission from the NVSS.
Current usage metrics show cumulative count of Article Views (full-text article views including HTML views, PDF and ePub downloads, according to the available data) and Abstracts Views on Vision4Press platform.
Data correspond to usage on the plateform after 2015. The current usage metrics is available 48-96 hours after online publication and is updated daily on week days.
Initial download of the metrics may take a while.