Fig. 5
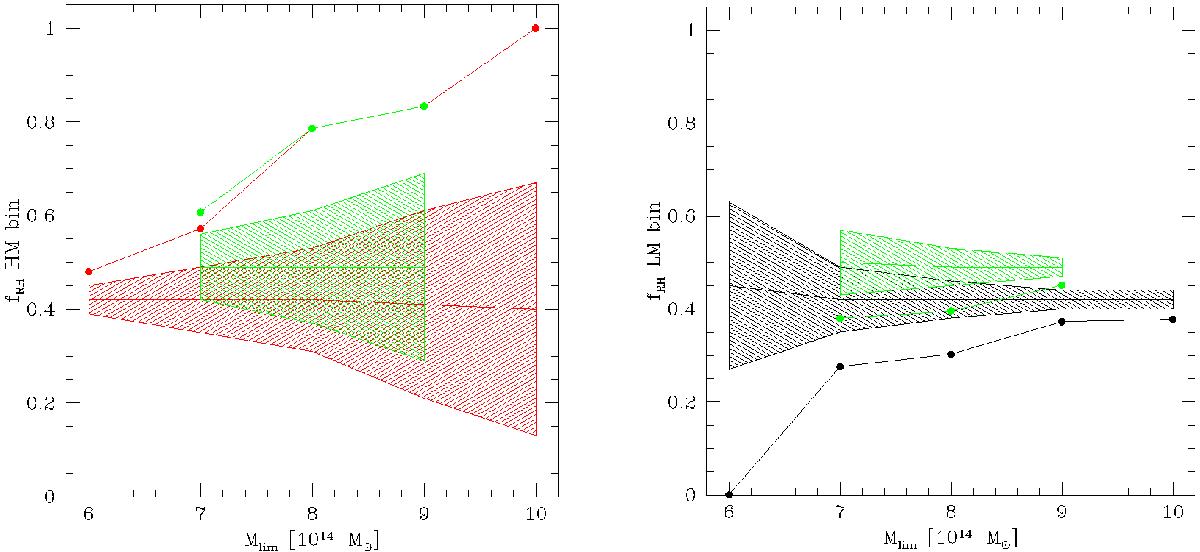
Observed fraction of RHs fRH (dots) compared to the value predicted by the Monte Carlo simulations (shadowed regions) in the HM bin (left panel) and in the LM bin (right panel) as a function of the limiting mass Mlim. In both panels the green dots and the green shadowed regions show the case in which the four clusters with suspect diffuse emission are considered as RH clusters.
Current usage metrics show cumulative count of Article Views (full-text article views including HTML views, PDF and ePub downloads, according to the available data) and Abstracts Views on Vision4Press platform.
Data correspond to usage on the plateform after 2015. The current usage metrics is available 48-96 hours after online publication and is updated daily on week days.
Initial download of the metrics may take a while.