Fig. 3
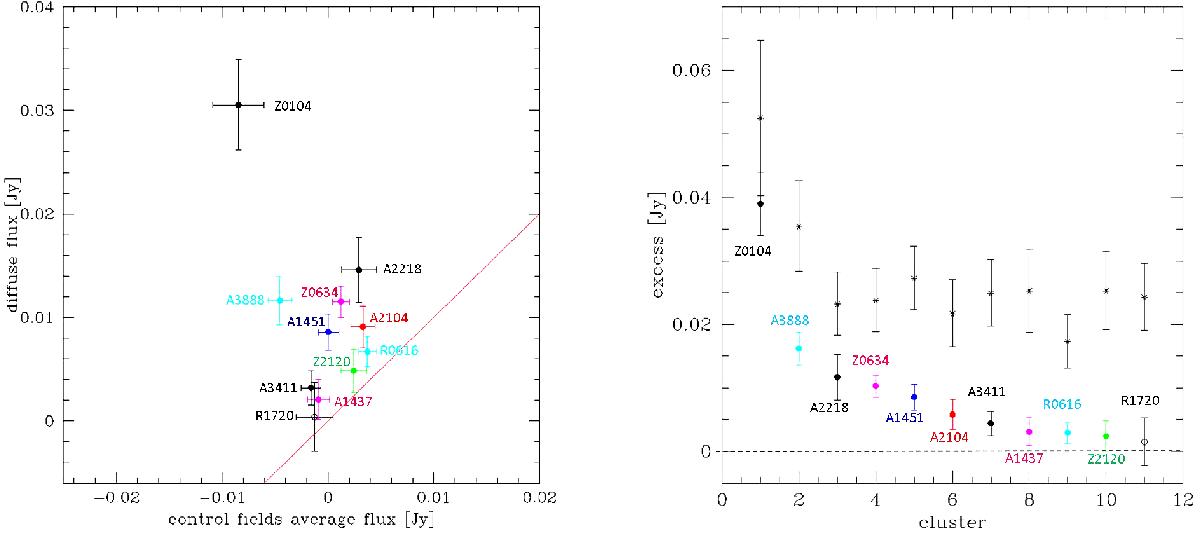
Left panel: diffuse flux density vs. control fields average flux density. Symbols: colored dots are clusters with reprocessed NVSS datasets; black filled dots are known RH clusters; and the black open dot is the mini-halo. The red line is the 1:1 line. Right panel: excess of diffuse flux with respect to the average control fields flux densities. Black asterisks represent the expected radio power of the RH on the basis of the P1.4−M500 correlation (Cassano et al. 2013).
Current usage metrics show cumulative count of Article Views (full-text article views including HTML views, PDF and ePub downloads, according to the available data) and Abstracts Views on Vision4Press platform.
Data correspond to usage on the plateform after 2015. The current usage metrics is available 48-96 hours after online publication and is updated daily on week days.
Initial download of the metrics may take a while.