Fig. 2
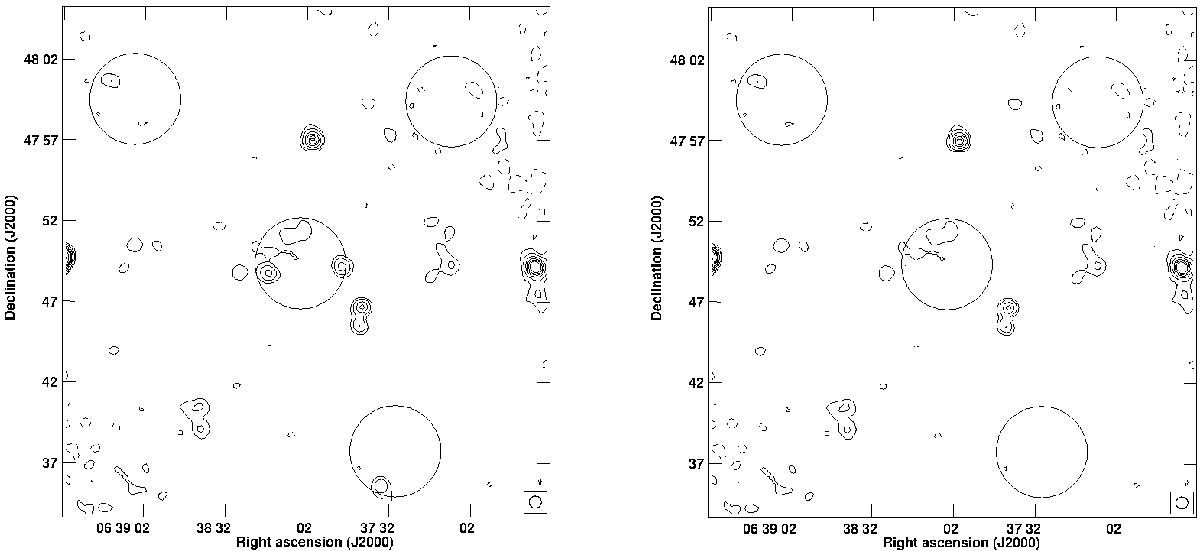
Zwcl0634.1+4750 NVSS map; the contour levels are 0.66 × (−1,1,2,4,6,8,10,16,32,64) mJy b-1. The 1σ level is 0.22 mJy b-1. In both panels the region where we extracted the flux densities are shown (solid circles). The central region has a diameter of 1 Mpc and is centred on the centroid of the X-ray emission; the other three areas are the control fields. With the task BLANK we masked the discrete sources in the central region and the one that falls in the lower control field (left panel).
Current usage metrics show cumulative count of Article Views (full-text article views including HTML views, PDF and ePub downloads, according to the available data) and Abstracts Views on Vision4Press platform.
Data correspond to usage on the plateform after 2015. The current usage metrics is available 48-96 hours after online publication and is updated daily on week days.
Initial download of the metrics may take a while.