Fig. 1
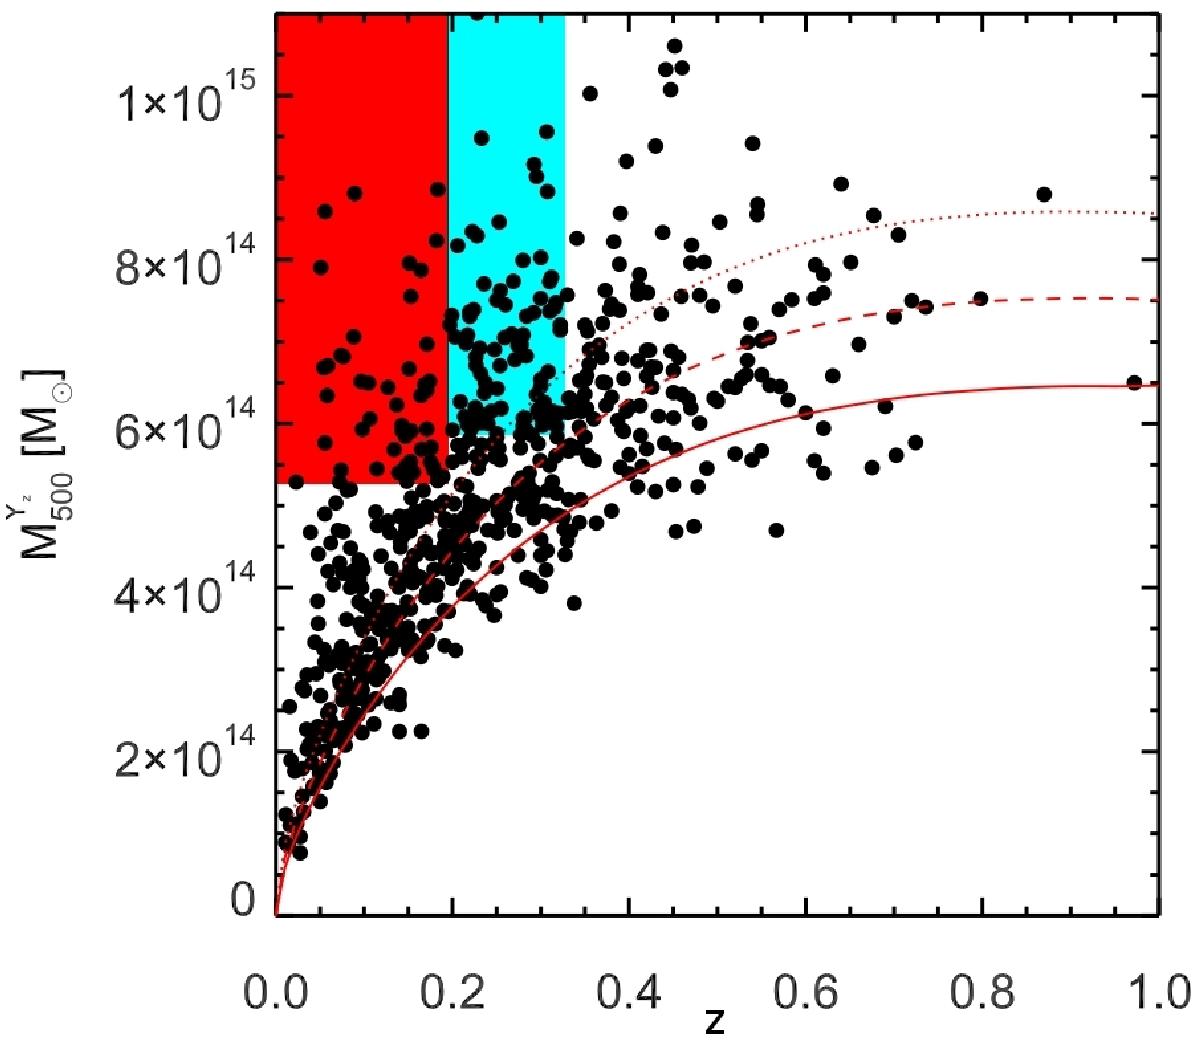
Average mass limit computed from the average noise over the sky for the PSZ catalogue. The dotted, dashed, and solid lines show the Planck mass limit at 80, 50, and 20% completeness, respectively. The rectangles show the regions where we extracted our sample: the red rectangle for the low redshift sample, the cyan retangle for the high redshift one. Adapted from Planck Collaboration XXIX (2014).
Current usage metrics show cumulative count of Article Views (full-text article views including HTML views, PDF and ePub downloads, according to the available data) and Abstracts Views on Vision4Press platform.
Data correspond to usage on the plateform after 2015. The current usage metrics is available 48-96 hours after online publication and is updated daily on week days.
Initial download of the metrics may take a while.