Fig. 9
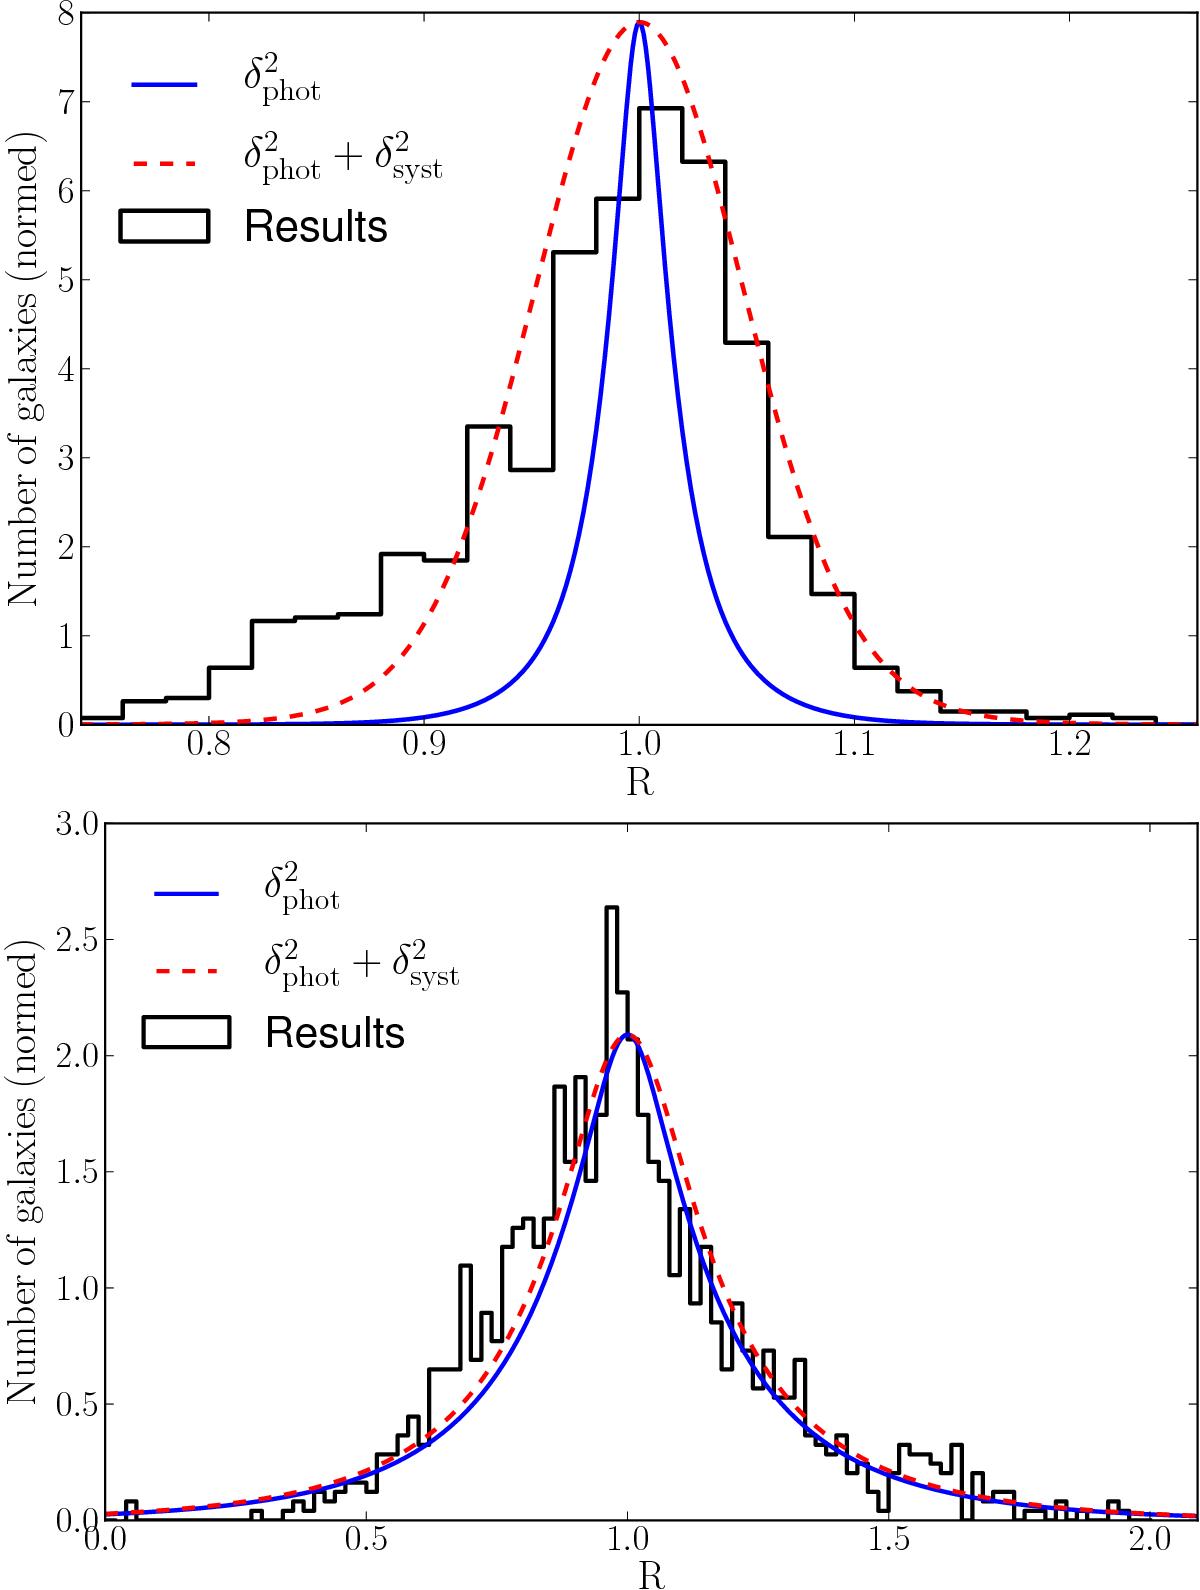
Top panel: black histogram denotes the distribution of R for the 1134 galaxies in S2, scaled to mr′ = 17.5. Blue curve shows the sum of 1134 normal distributions centred at μ = 1 and with σ = δphot. Red dashed curve is the sum of 1134 normal distributions centred at μ = 1 and with ![]() . Bottom panel: same as above, except for spectra scaled to mr′ = 21.25.
. Bottom panel: same as above, except for spectra scaled to mr′ = 21.25.
Current usage metrics show cumulative count of Article Views (full-text article views including HTML views, PDF and ePub downloads, according to the available data) and Abstracts Views on Vision4Press platform.
Data correspond to usage on the plateform after 2015. The current usage metrics is available 48-96 hours after online publication and is updated daily on week days.
Initial download of the metrics may take a while.