Fig. 5
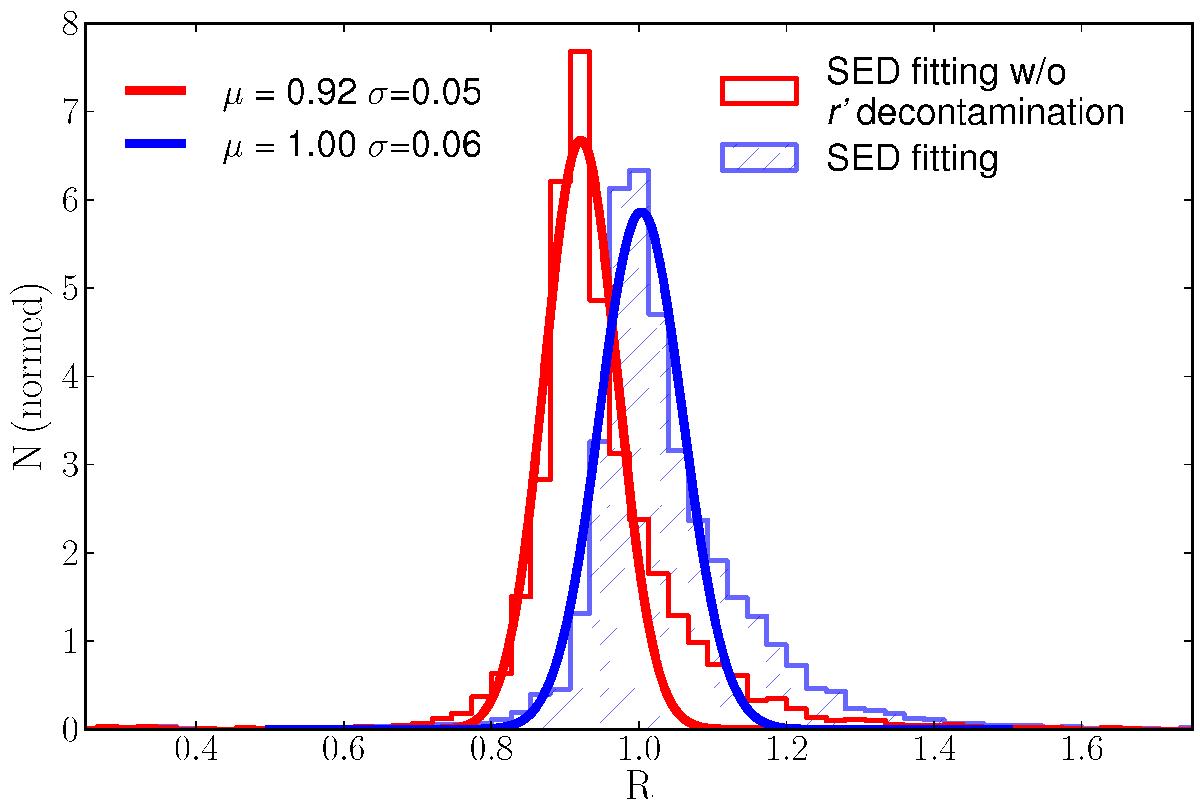
Normalized distribution of the ratios between the recovered and the spectroscopically measured Hα + [N ii] flux for S1 spectra, with the SED-fitting routines. Empty red histogram shows the results after SED-fitting method without r’ decontamination. Dashed blue histogram denotes the results after SED-fitting method with r’ decontamination. Solid curves indicate Gaussian fits to the distribution of R. The best fitting values are labelled in the panel.
Current usage metrics show cumulative count of Article Views (full-text article views including HTML views, PDF and ePub downloads, according to the available data) and Abstracts Views on Vision4Press platform.
Data correspond to usage on the plateform after 2015. The current usage metrics is available 48-96 hours after online publication and is updated daily on week days.
Initial download of the metrics may take a while.