Fig. 3
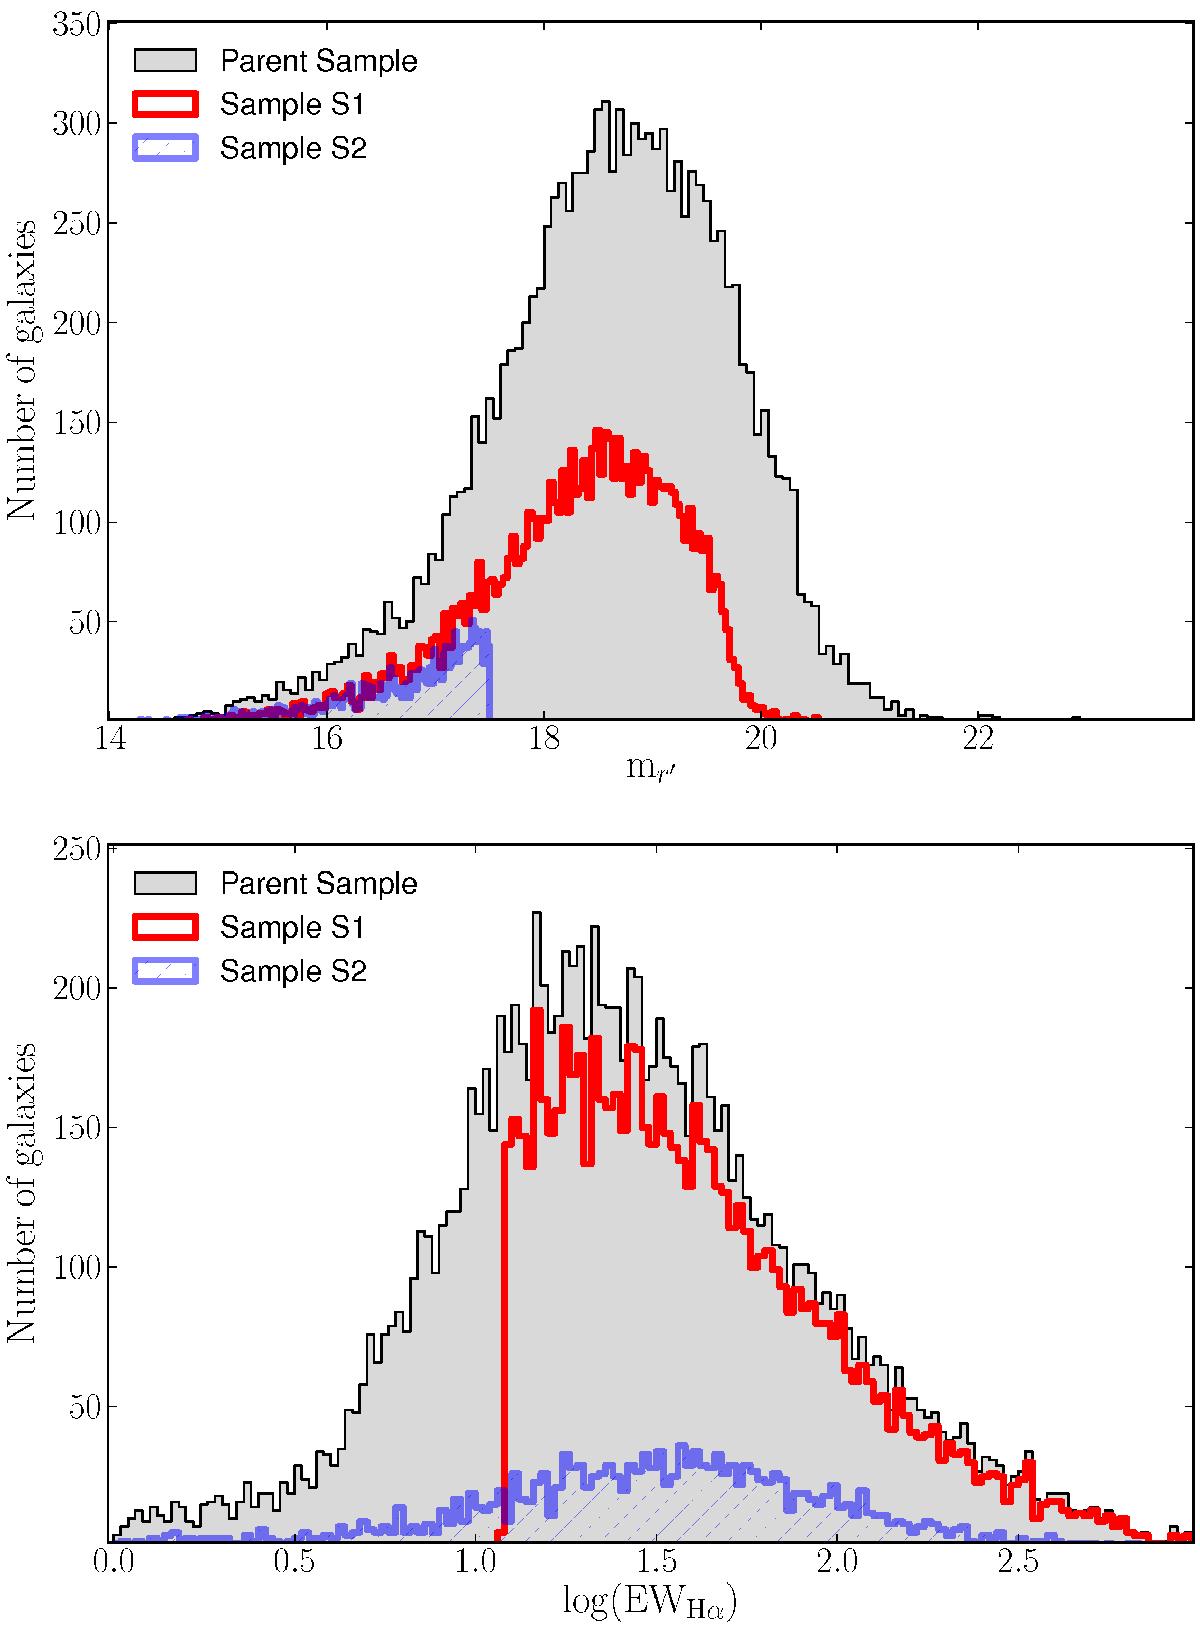
SDSS star-forming sources with z< 0.02 (grey areas); top panel: red line shows the sample S1 distributed as a function of mr′. Dashed area denotes the sample S2 (see Sect. 5.3.1) distributed as a function of mr′. Bottom panel: red line shows sample S1 distributed as a function of log EWHα. Dashed area illustrates the sample S2 (see Sect. 5.3.1) distributed as a function of log EWHα.
Current usage metrics show cumulative count of Article Views (full-text article views including HTML views, PDF and ePub downloads, according to the available data) and Abstracts Views on Vision4Press platform.
Data correspond to usage on the plateform after 2015. The current usage metrics is available 48-96 hours after online publication and is updated daily on week days.
Initial download of the metrics may take a while.