Free Access
Fig. 13
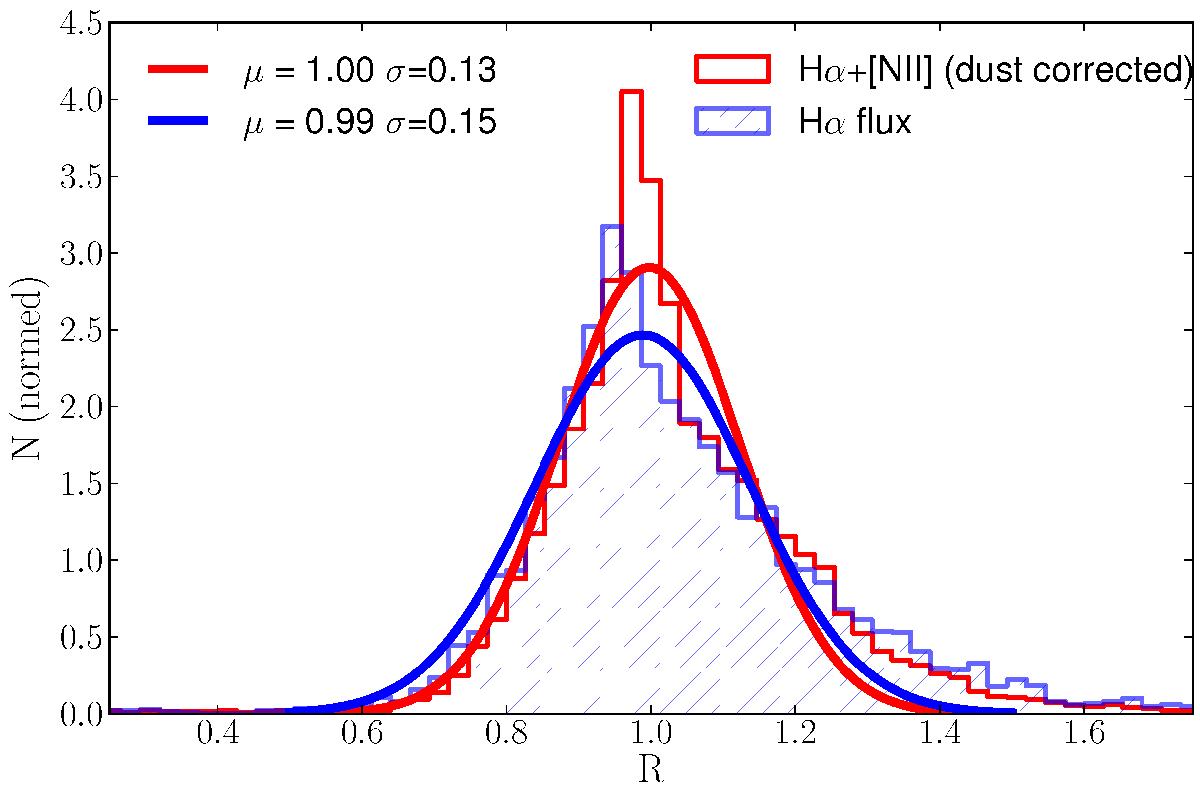
Distribution of the recovered Hα + [N ii] after correcting for dust (empty red histogram); distribution of the recovered Hα flux after correcting for dust (dashed blue histogram); and [N ii]; Solid lines indicate Gaussian fits to the data. Best-fitting values are labelled in the panel.
Current usage metrics show cumulative count of Article Views (full-text article views including HTML views, PDF and ePub downloads, according to the available data) and Abstracts Views on Vision4Press platform.
Data correspond to usage on the plateform after 2015. The current usage metrics is available 48-96 hours after online publication and is updated daily on week days.
Initial download of the metrics may take a while.