Free Access
Fig. 12
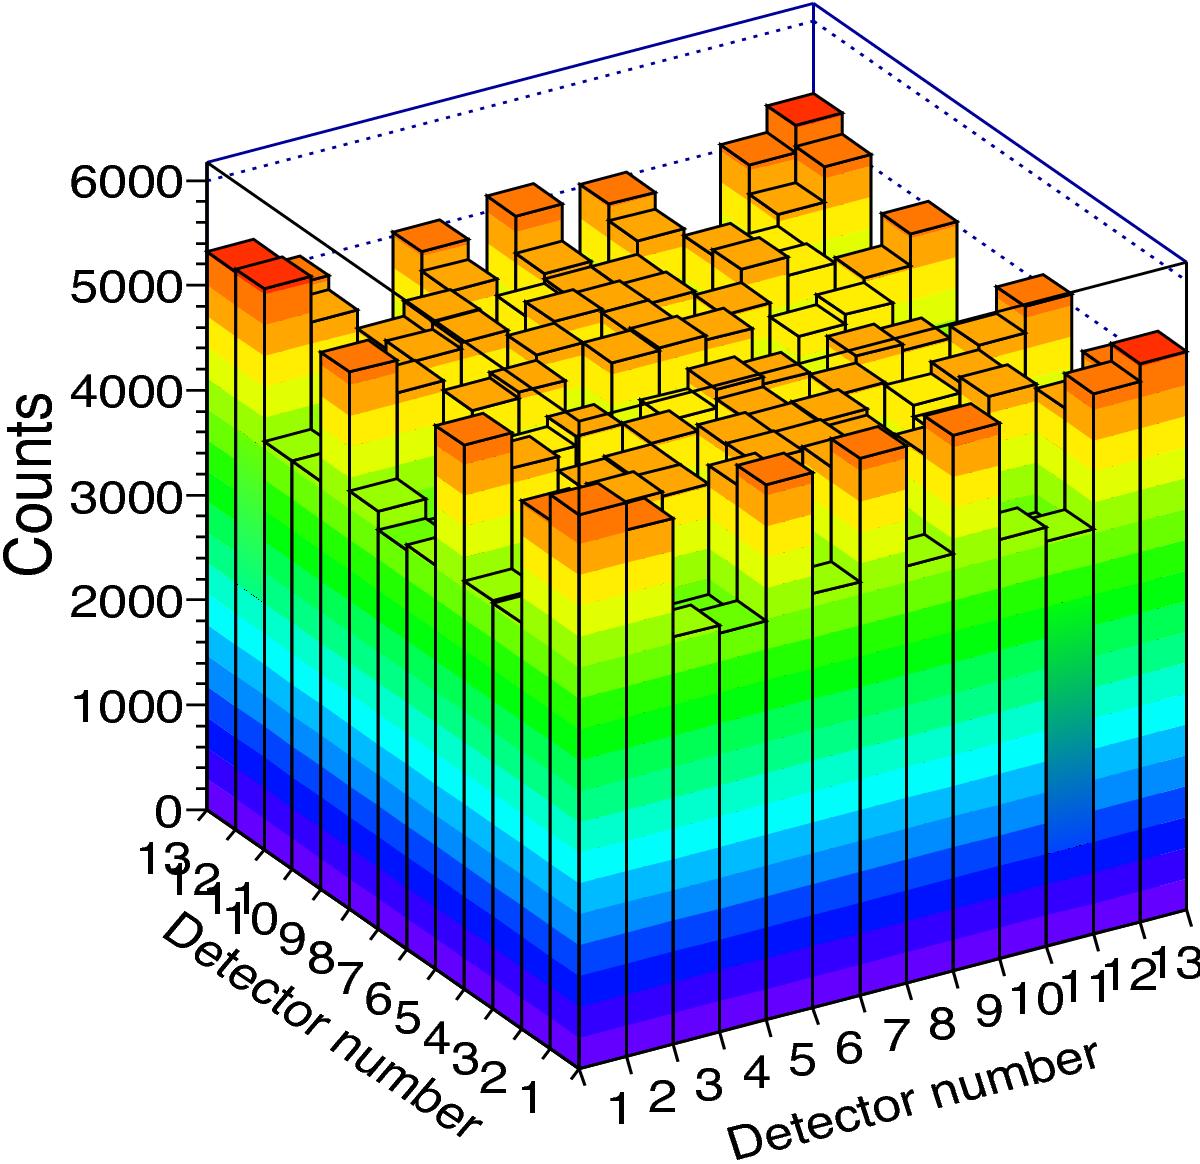
Count distribution (shadowgram) on the detector plane of a simulated observation of the Crab, including the expected background, for an integration time of 4 h around the meridian passage at a latitude of 23° S. The energy range is 30 to 200 keV.
Current usage metrics show cumulative count of Article Views (full-text article views including HTML views, PDF and ePub downloads, according to the available data) and Abstracts Views on Vision4Press platform.
Data correspond to usage on the plateform after 2015. The current usage metrics is available 48-96 hours after online publication and is updated daily on week days.
Initial download of the metrics may take a while.