Fig. 11
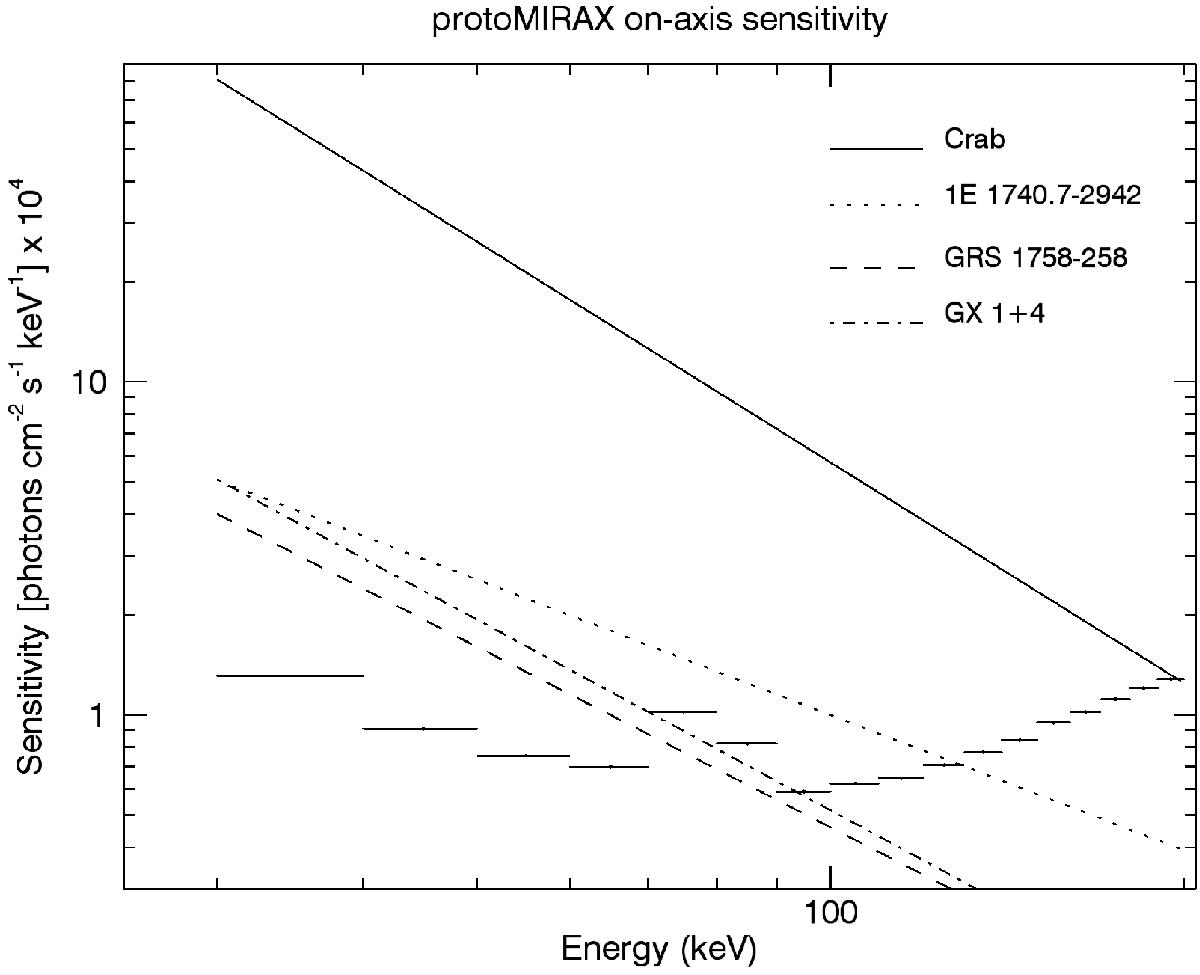
On-axis sensitivity curve for protoMIRAX. The horizontal bars are the minimum detectable fluxes at a level of 3σ at an atmospheric depth of 2.7 g cm-2 and a zenith angle of 30°. The integration time is 8 hours. Also shown are the spectra of 4 X-ray sources that will be observed in the first balloon flight. The source spectra were taken from Sizun et al. (2004; Crab), Grebenev et al. (1995; 1E 1740.7−2942), Sunyaev et al. (1991b; GRS 1758−258) and Dieters et al. (1991; GX 1 + 4).
Current usage metrics show cumulative count of Article Views (full-text article views including HTML views, PDF and ePub downloads, according to the available data) and Abstracts Views on Vision4Press platform.
Data correspond to usage on the plateform after 2015. The current usage metrics is available 48-96 hours after online publication and is updated daily on week days.
Initial download of the metrics may take a while.