Fig. 12
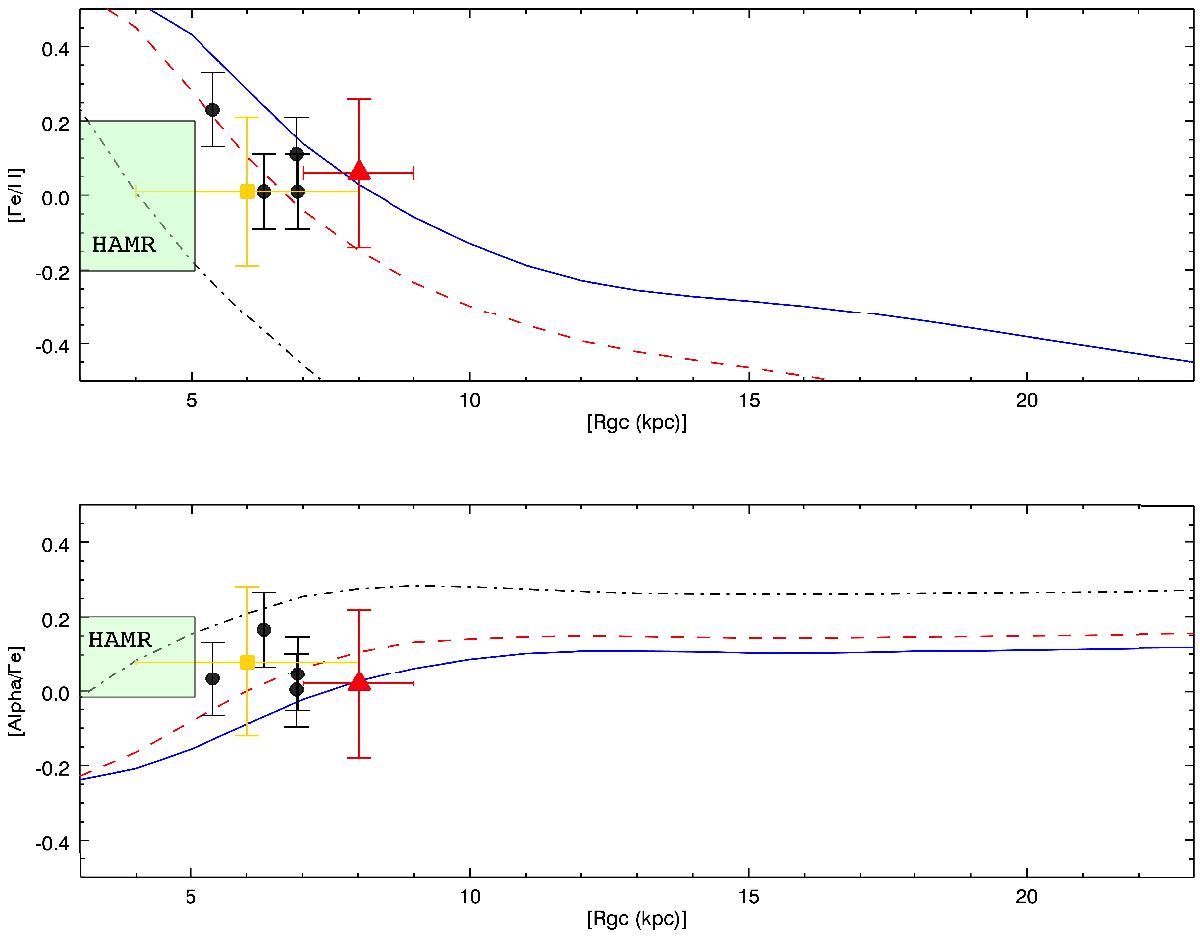
[Fe/H] vs. RGC (upper panel) and RGC vs. [α/Fe] (lower panel) in the chemical evolution model of Magrini et al. (2009). The three curves are the curve at present time (blue), ~5 Gyr ago (red) and ~10 Gyr ago (black). The green shaded area indicates where and when HAMR stars might be born, the black filled circles are the four open clusters and the yellow squares are the median values of the inner disc field stars in the metallicity range from −0.1 to +0.33 dex, whose [α/Fe] are computed removing the NLTE effects. Finally, the red triangles are the median values of the solar neighbourhood stars in the metallicity range from −0.1 to +0.33 dex.
Current usage metrics show cumulative count of Article Views (full-text article views including HTML views, PDF and ePub downloads, according to the available data) and Abstracts Views on Vision4Press platform.
Data correspond to usage on the plateform after 2015. The current usage metrics is available 48-96 hours after online publication and is updated daily on week days.
Initial download of the metrics may take a while.