Fig. 1
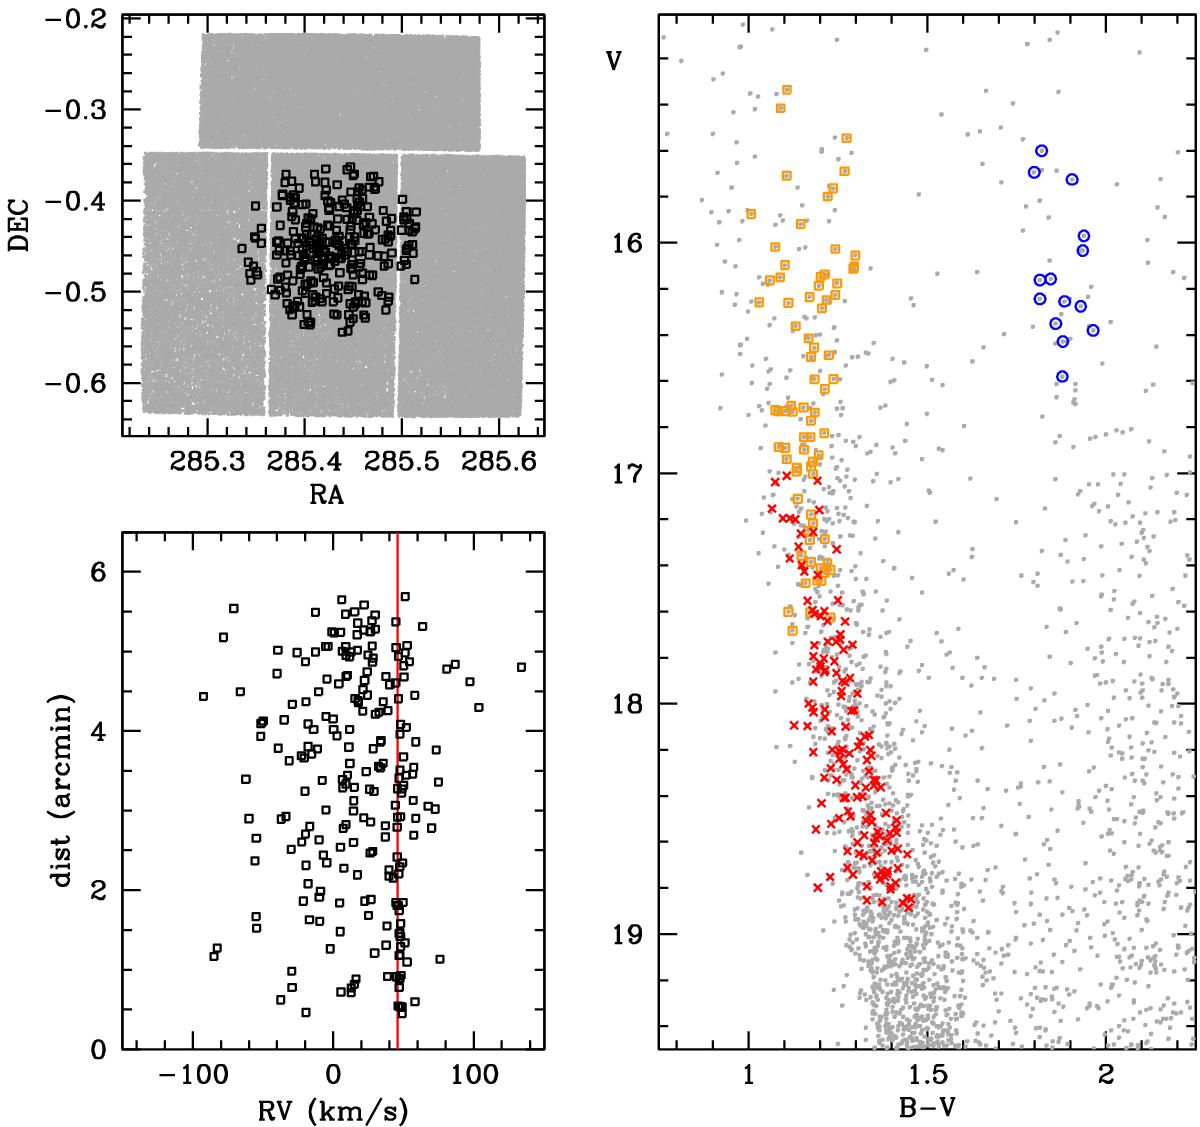
Upper left panel: in grey the Be 81 field of view of the photometric data in Donati et al. (2014a), obtained with LBC at LBT; in black the stars observed by the Gaia-ESO survey, all inside a radius of 6 arcmin. Lower left panel: distribution of the radial velocities vs. distance from the cluster centre. The red line is the cluster systemic radial velocity. Right panel: CMD of the inner 6 arcmin, with stars observed indicated by larger symbols (orange squares HR09B; red crosses HR15N; blue circles UVES).
Current usage metrics show cumulative count of Article Views (full-text article views including HTML views, PDF and ePub downloads, according to the available data) and Abstracts Views on Vision4Press platform.
Data correspond to usage on the plateform after 2015. The current usage metrics is available 48-96 hours after online publication and is updated daily on week days.
Initial download of the metrics may take a while.