Fig. 1
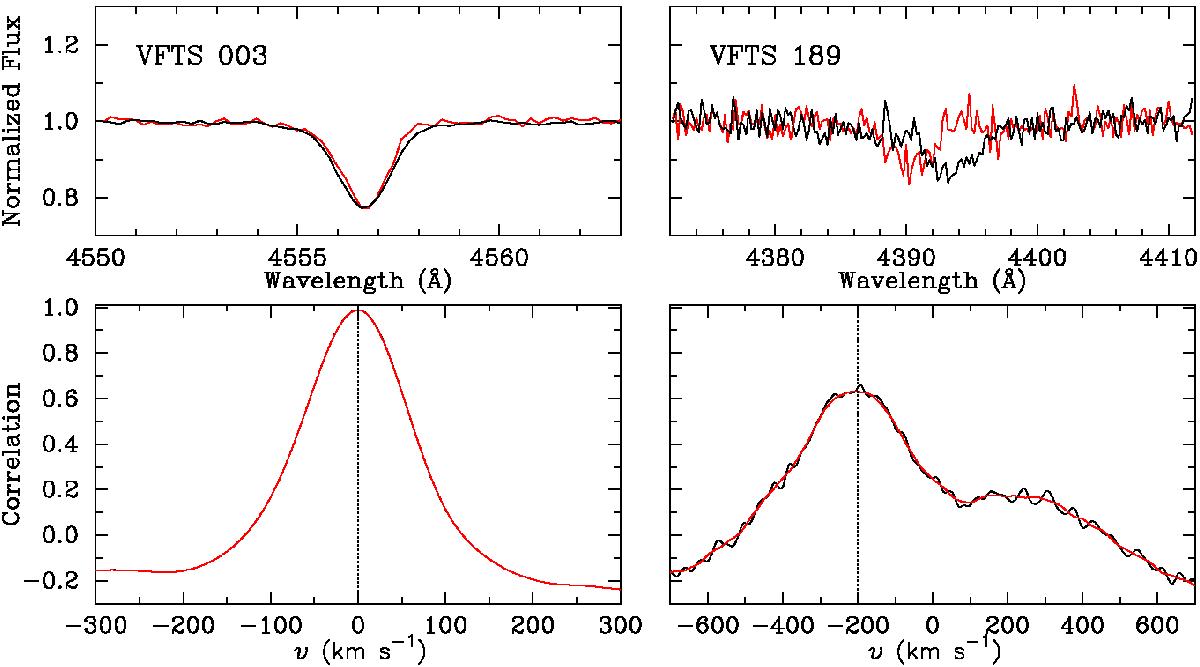
Examples of the methodology to estimate RV shifts between the spectra. Left-hand panels: VFTS 003 is a relatively bright narrow-lined supergiant. The upper panel shows the Si iii 4553 Å line in the template spectrum (MJD = 54 804.148, black line) and at MJD = 55 108.309 (red). The lower panel shows the original (black line) and smoothed (red) cross-correlation function in velocity space; no significant velocity shifts were found for this target. Right-hand panels: VFTS 189 is a relatively faint, broad-lined, main-sequence star. The upper panel shows the He i 4388 Å line in the template spectrum (MJD = 54 867.160, black) and at MJD = 54 824.242 (red). The lower panel shows the original and smoothed cross-correlation functions in velocity space; the estimated RV shift between these was ~200 km s-1.
Current usage metrics show cumulative count of Article Views (full-text article views including HTML views, PDF and ePub downloads, according to the available data) and Abstracts Views on Vision4Press platform.
Data correspond to usage on the plateform after 2015. The current usage metrics is available 48-96 hours after online publication and is updated daily on week days.
Initial download of the metrics may take a while.