Fig. 7
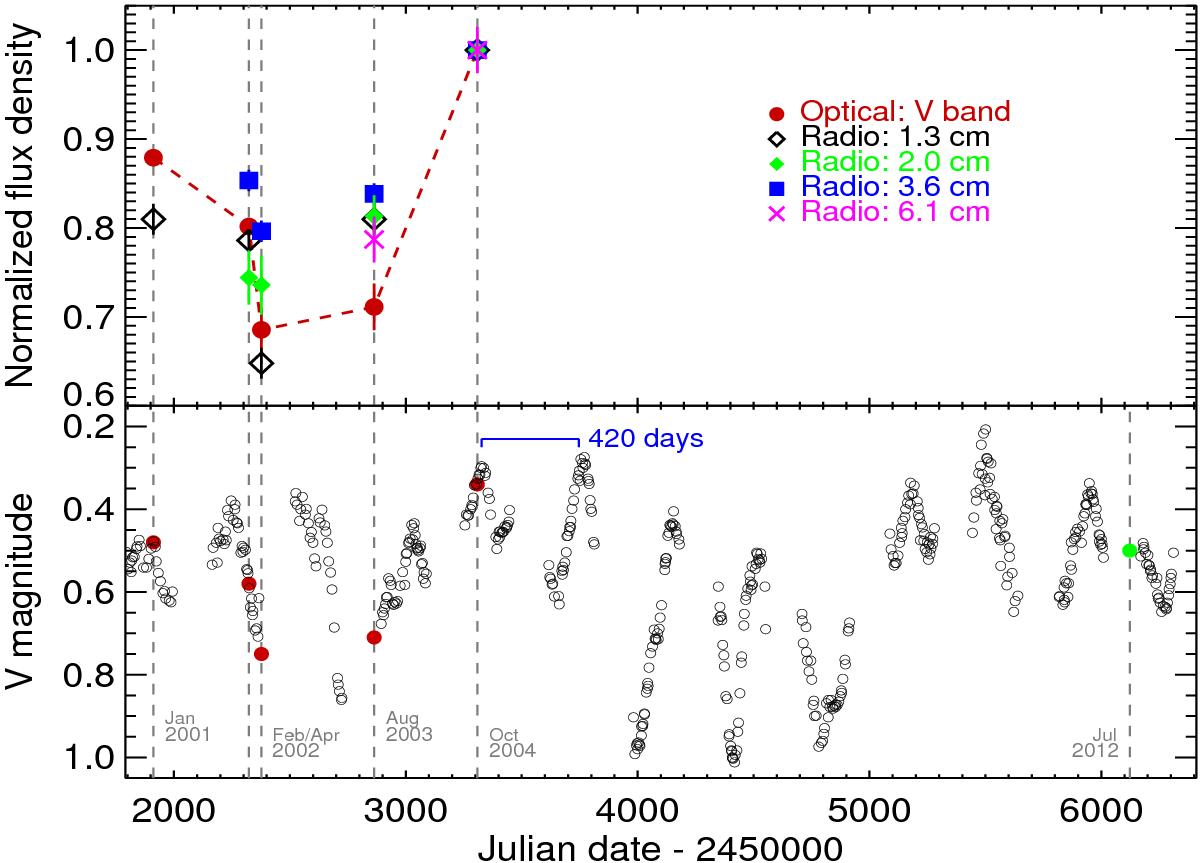
Top panel: variation of V band optical photometry with our radio flux density values for all wavelengths between 1.3 and 6.1 cm. The optical photometry has units of flux density and has been normalized to the October 21–30 2004 value. The radio flux densities at each wavelength have also been normalized to their corresponding October 21–30 2004 value. Bottom panel: original V band optical photometry in units of V magnitude. The red and green filled circles are the V band photometric data at the corresponding dates of the radio observations. An example of the well known ~420 days period is included which is believed to originate from stellar pulsations. The dashed lines in both panels should guide the eye.
Current usage metrics show cumulative count of Article Views (full-text article views including HTML views, PDF and ePub downloads, according to the available data) and Abstracts Views on Vision4Press platform.
Data correspond to usage on the plateform after 2015. The current usage metrics is available 48-96 hours after online publication and is updated daily on week days.
Initial download of the metrics may take a while.