Fig. 5
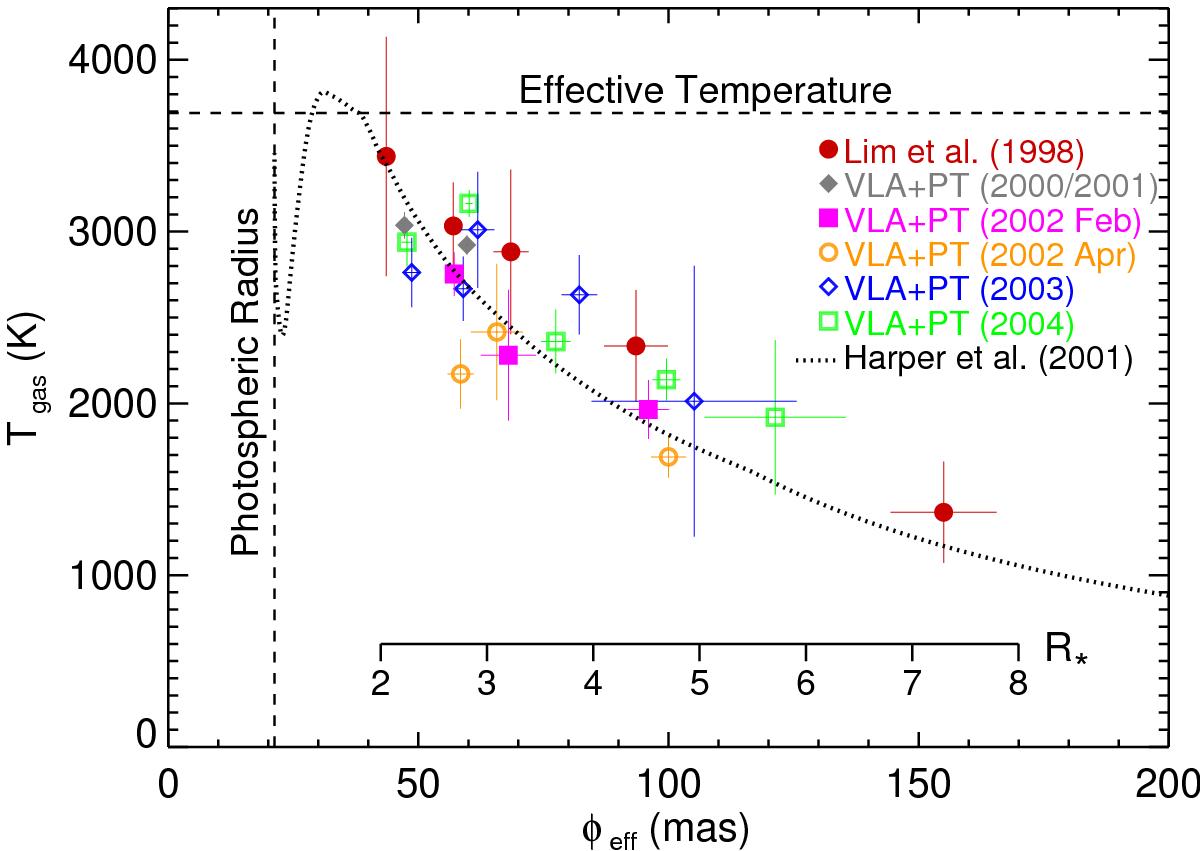
Mean gas temperature profile of Betelgeuse’s extended atmosphere revealed by multi-wavelength spatially resolved VLA and VLA/PT observations spanning 1996−2004. The red filled circles are from the work of L+98 while the dotted line is the predicted gas temperature profile from the semi-empirical model of Harper et al. (2001). All other data points are from this work. The error bars represent the ±1σrms level, except the 0.7 cm error bars of L+98 which include a ±20% uncertainty in the absolute flux density. The vertical and horizontal dashed lines represent the photospheric radius of 21.24 mas and the photospheric effective temperature of 3690 K, respectively (Ohnaka et al. 2011).
Current usage metrics show cumulative count of Article Views (full-text article views including HTML views, PDF and ePub downloads, according to the available data) and Abstracts Views on Vision4Press platform.
Data correspond to usage on the plateform after 2015. The current usage metrics is available 48-96 hours after online publication and is updated daily on week days.
Initial download of the metrics may take a while.