Fig. 4
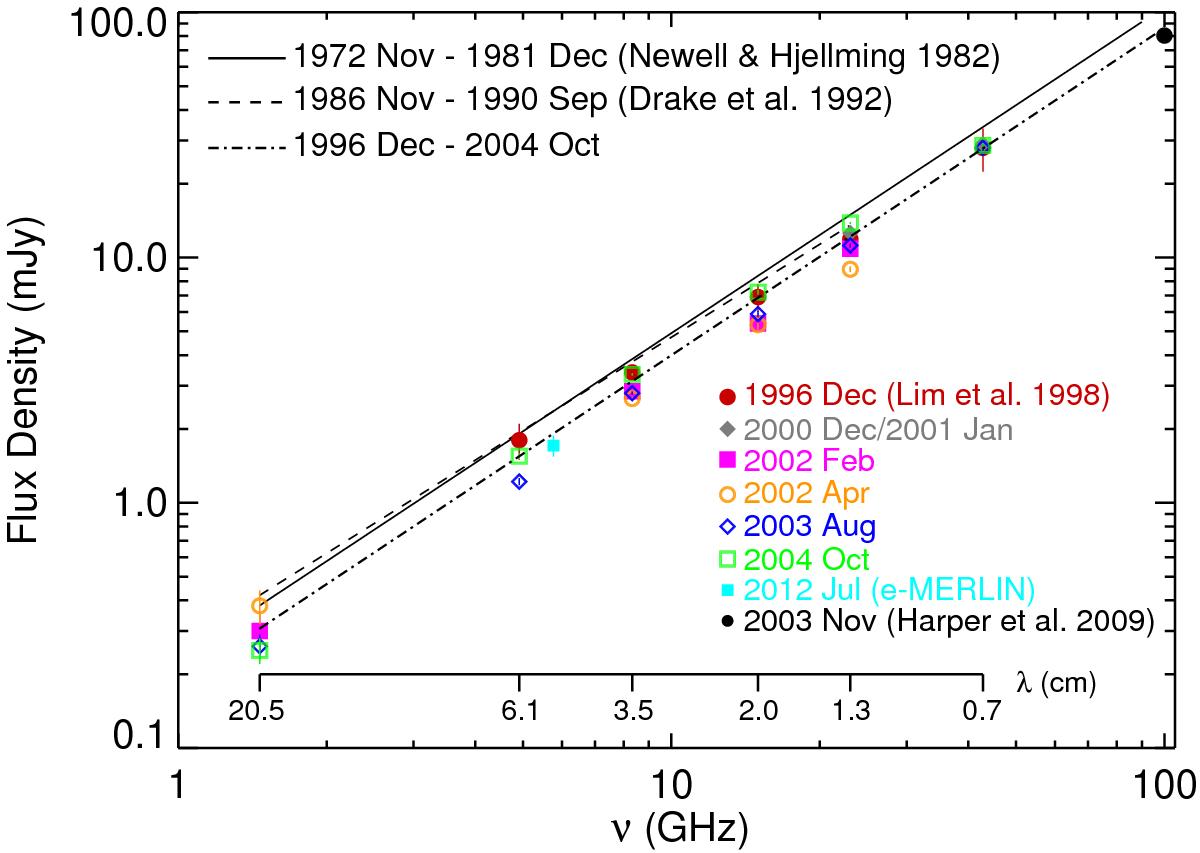
Radio spectra for Betelgeuse at VLA wavelengths spanning 1972–2012. The continuous line represents the radio spectrum from Newell & Hjellming (1982) and includes measurements up to 90 GHz. The dashed line is the almost identical spectrum from Drake et al. (1992). The dash-dotted line is the radio spectrum that best fits the more recent data between 1996–2004 and is described by Fν = 0.18 mJy ν1.33. The flux density from the e-MERLIN 5.2 cm observation and a 100 GHz flux density measurement from Harper et al. (2009) are also shown.
Current usage metrics show cumulative count of Article Views (full-text article views including HTML views, PDF and ePub downloads, according to the available data) and Abstracts Views on Vision4Press platform.
Data correspond to usage on the plateform after 2015. The current usage metrics is available 48-96 hours after online publication and is updated daily on week days.
Initial download of the metrics may take a while.