Fig. 2
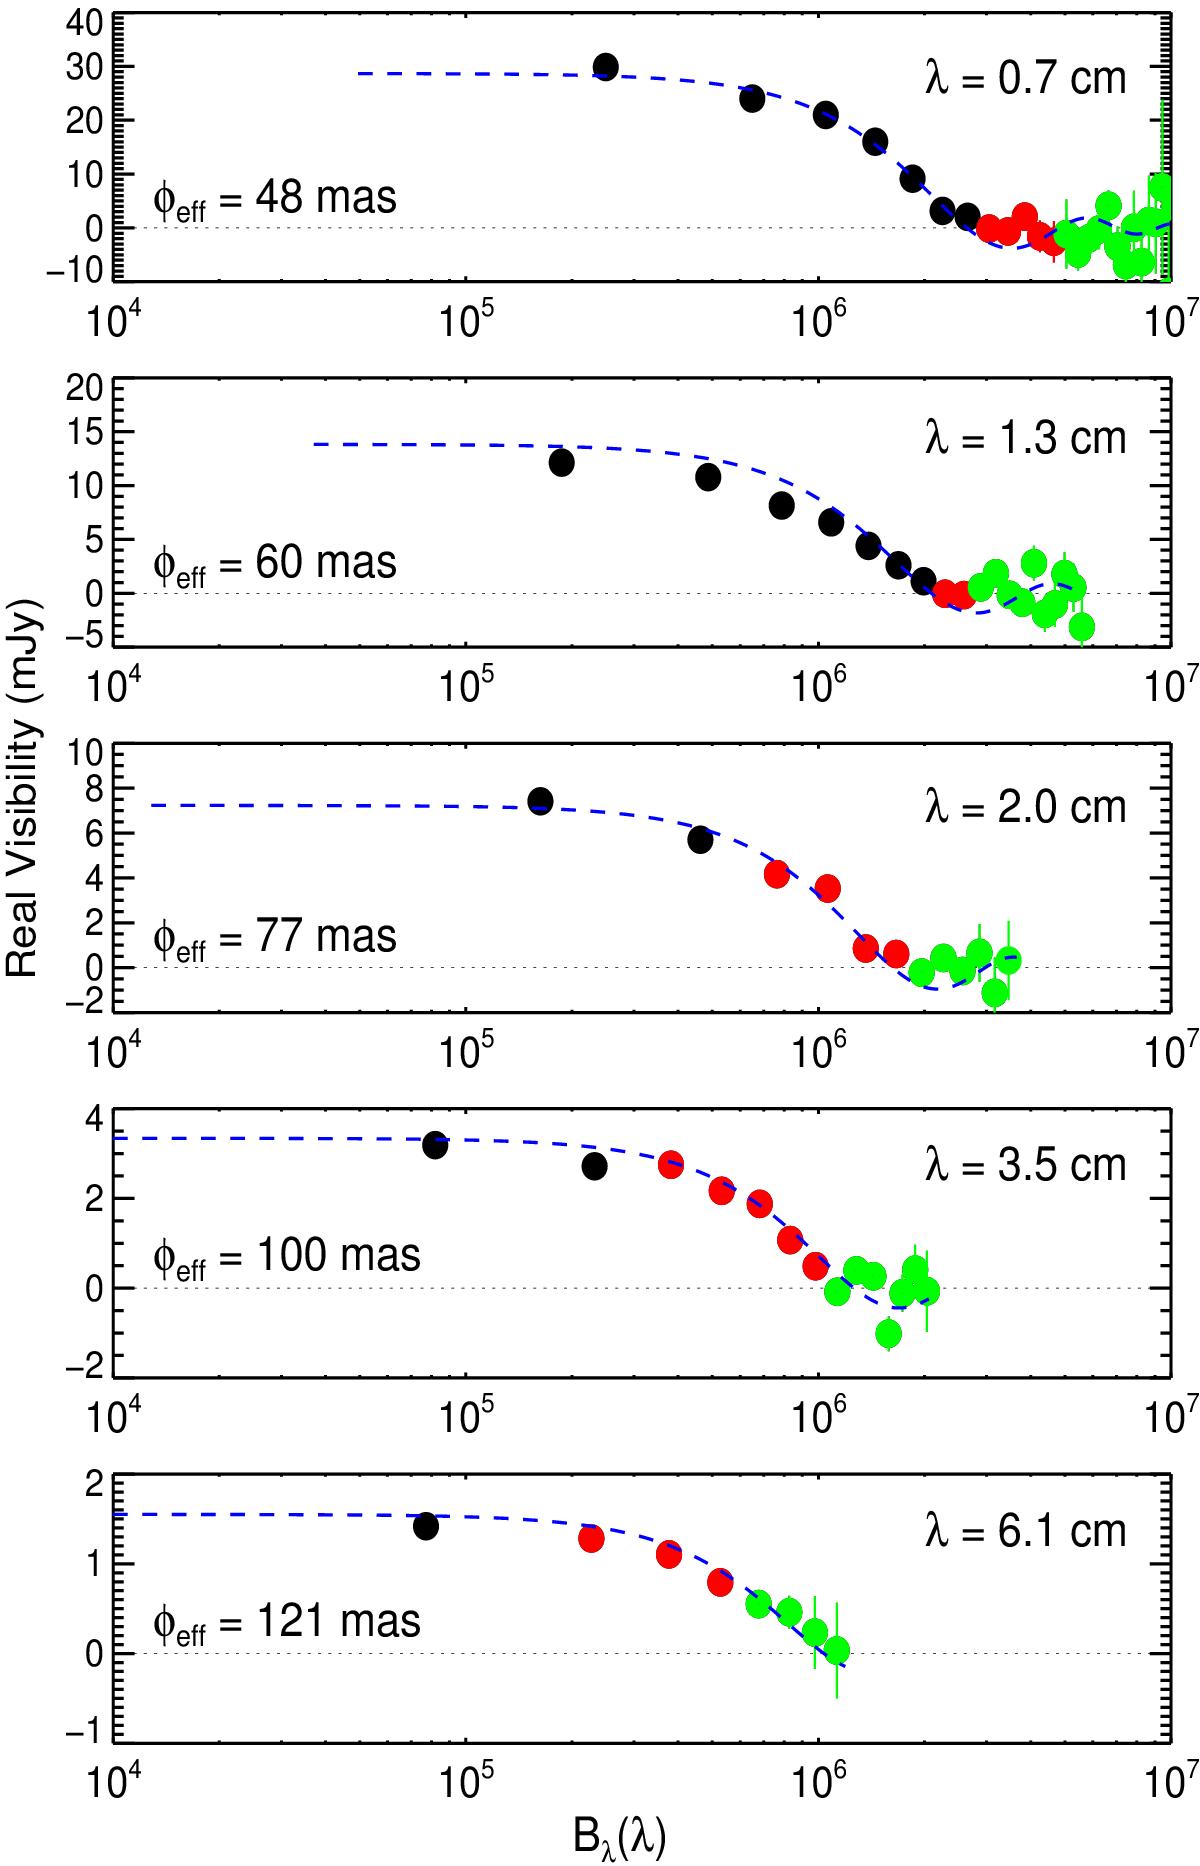
Real component of the complex visibility plotted against the projected baseline length in wavelengths, Bλ, for the 2004 epoch at all wavelengths between 0.7–6.1 cm. The black data points contain only VLA antenna baselines, the red data points contain both VLA and PT antenna baselines, while the green data points contain only PT antenna baselines. The dashed blue line represents the theoretical visibilities of a uniform intensity circular disk with an effective angular radius defined as ![]() .
.
Current usage metrics show cumulative count of Article Views (full-text article views including HTML views, PDF and ePub downloads, according to the available data) and Abstracts Views on Vision4Press platform.
Data correspond to usage on the plateform after 2015. The current usage metrics is available 48-96 hours after online publication and is updated daily on week days.
Initial download of the metrics may take a while.