Fig. 9
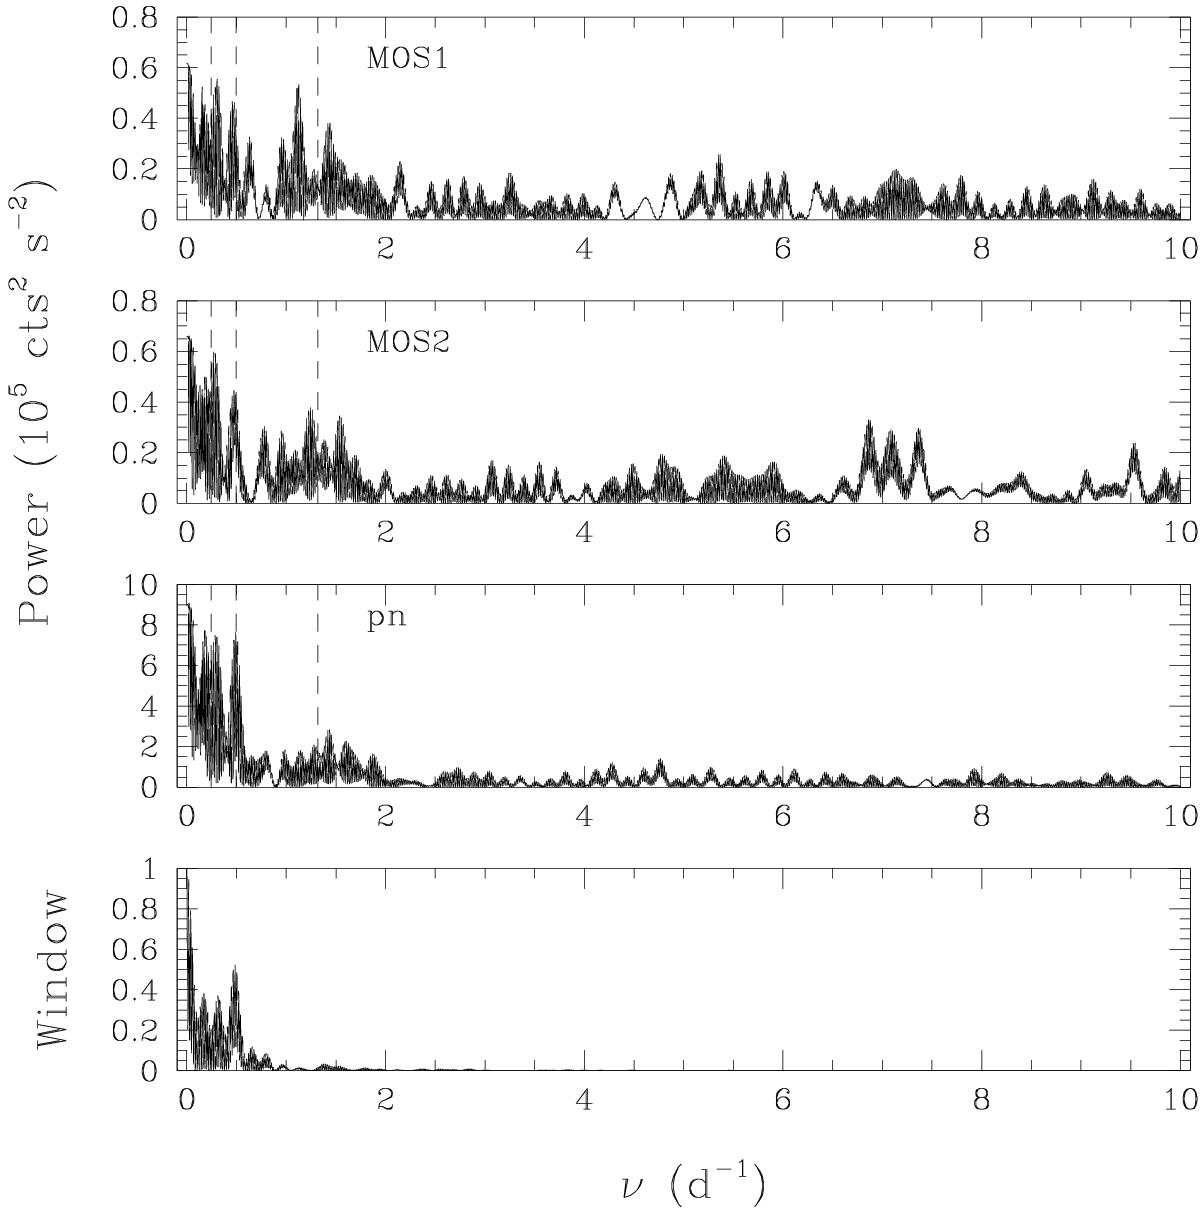
Fourier analysis of the X-ray lightcurves of λ Cep in June and August 2013. The top three panels show the power spectra for the three EPIC instruments whilst the bottom panel displays the power spectral window of the EPIC-pn time series. MOS1 and MOS2 have very similar spectral windows. The dashed vertical lines indicate the frequencies ν1 = 1.315, ν2 = 0.245 and ν3 = 0.495 d-1 found in the analysis of our optical spectra.
Current usage metrics show cumulative count of Article Views (full-text article views including HTML views, PDF and ePub downloads, according to the available data) and Abstracts Views on Vision4Press platform.
Data correspond to usage on the plateform after 2015. The current usage metrics is available 48-96 hours after online publication and is updated daily on week days.
Initial download of the metrics may take a while.