Fig. 6
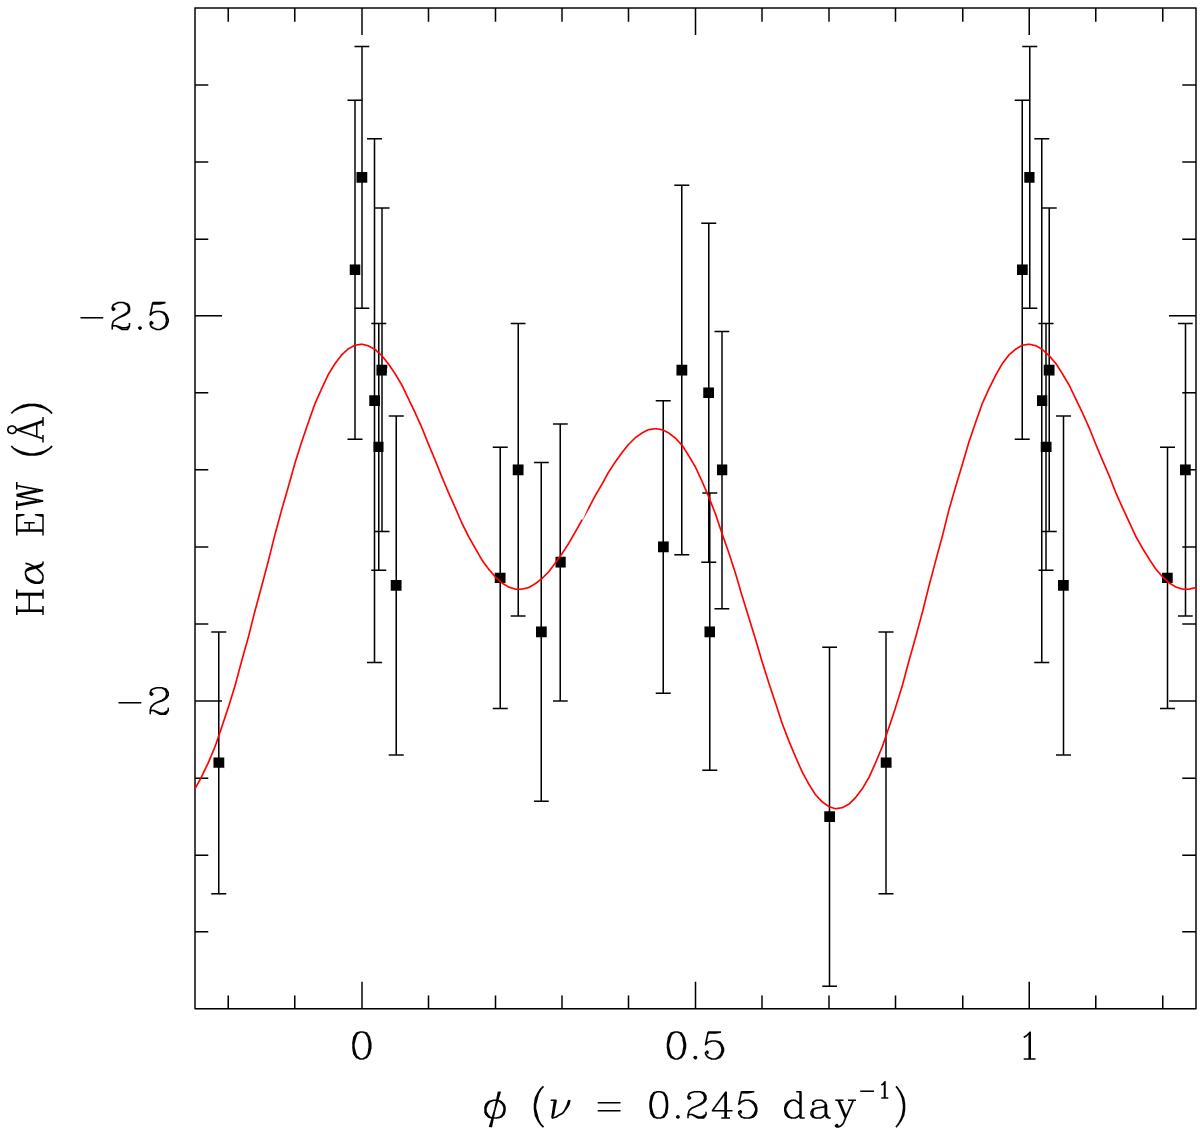
Variations of the EW of the Hα line. Phase 0.0 corresponds to the time of the first optical spectrum of the August 2013 campaign (HJD 2 456 507.7607). The solid curve shows the expected variations as reconstructed from the amplitudes and phases of the ν2 and 2 × ν2 frequencies (see Fig. 5), whilst the data points with error bars correspond to the actual EWs measured in August 2013.
Current usage metrics show cumulative count of Article Views (full-text article views including HTML views, PDF and ePub downloads, according to the available data) and Abstracts Views on Vision4Press platform.
Data correspond to usage on the plateform after 2015. The current usage metrics is available 48-96 hours after online publication and is updated daily on week days.
Initial download of the metrics may take a while.