Free Access
Fig. 5
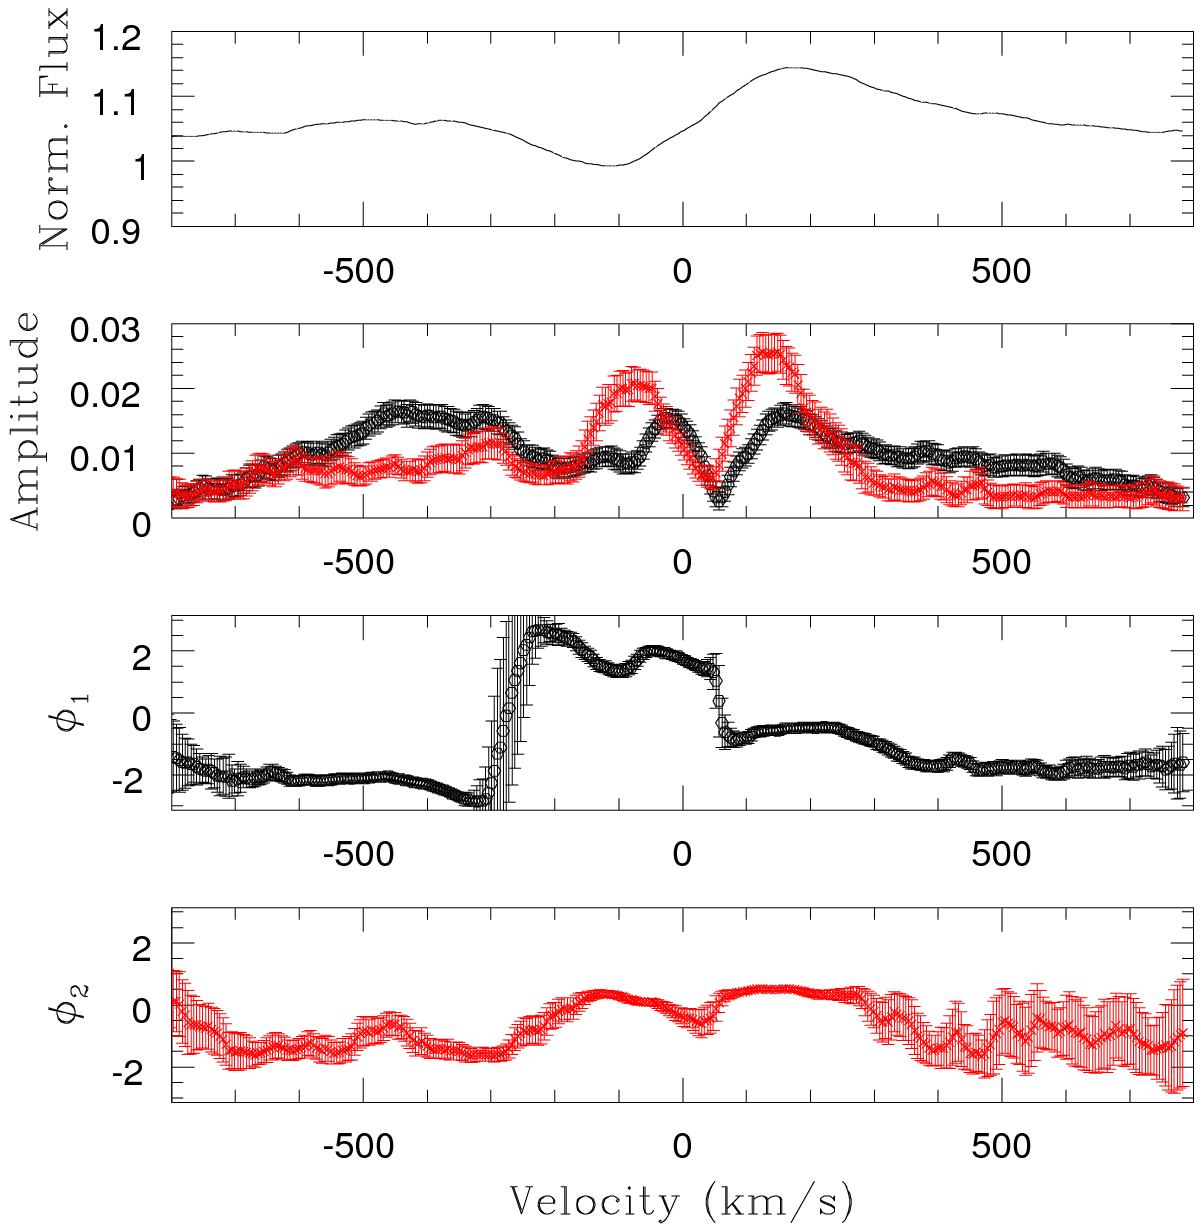
Variations of the Hα emission line with the ν2 and ν3 frequencies in August 2013. From top to bottom, the panels illustrate the mean line profile, the amplitudes (black and red symbols stand for the variations at frequency ν2 and ν3, respectively), and the phase constants of the modulation as a function of wavelength.
Current usage metrics show cumulative count of Article Views (full-text article views including HTML views, PDF and ePub downloads, according to the available data) and Abstracts Views on Vision4Press platform.
Data correspond to usage on the plateform after 2015. The current usage metrics is available 48-96 hours after online publication and is updated daily on week days.
Initial download of the metrics may take a while.