Fig. 4
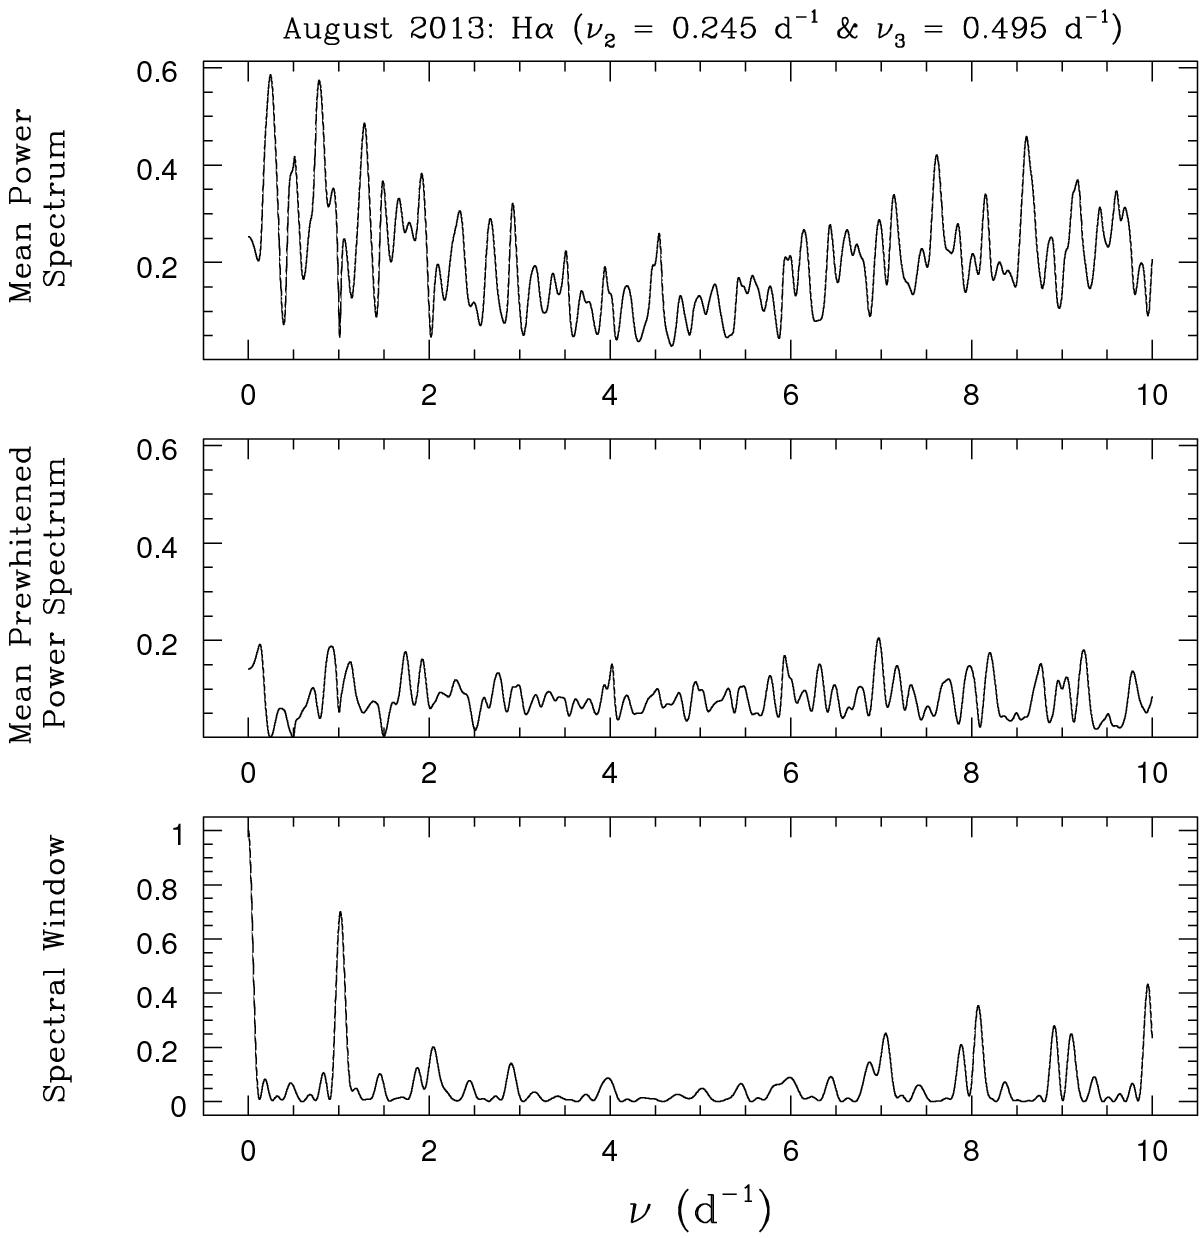
Same as Fig. 2, but for the Hα emission line as observed in August 2013. The mean periodogram over the wavelength interval 6545−6580 Å (top panel) reveals its highest peak at ν2 = 0.245 day-1. The middle panel displays the residual periodogram once the data have been prewhitened for the signal corresponding to the ν2 and ν3 frequencies.
Current usage metrics show cumulative count of Article Views (full-text article views including HTML views, PDF and ePub downloads, according to the available data) and Abstracts Views on Vision4Press platform.
Data correspond to usage on the plateform after 2015. The current usage metrics is available 48-96 hours after online publication and is updated daily on week days.
Initial download of the metrics may take a while.