Free Access
Fig. 20
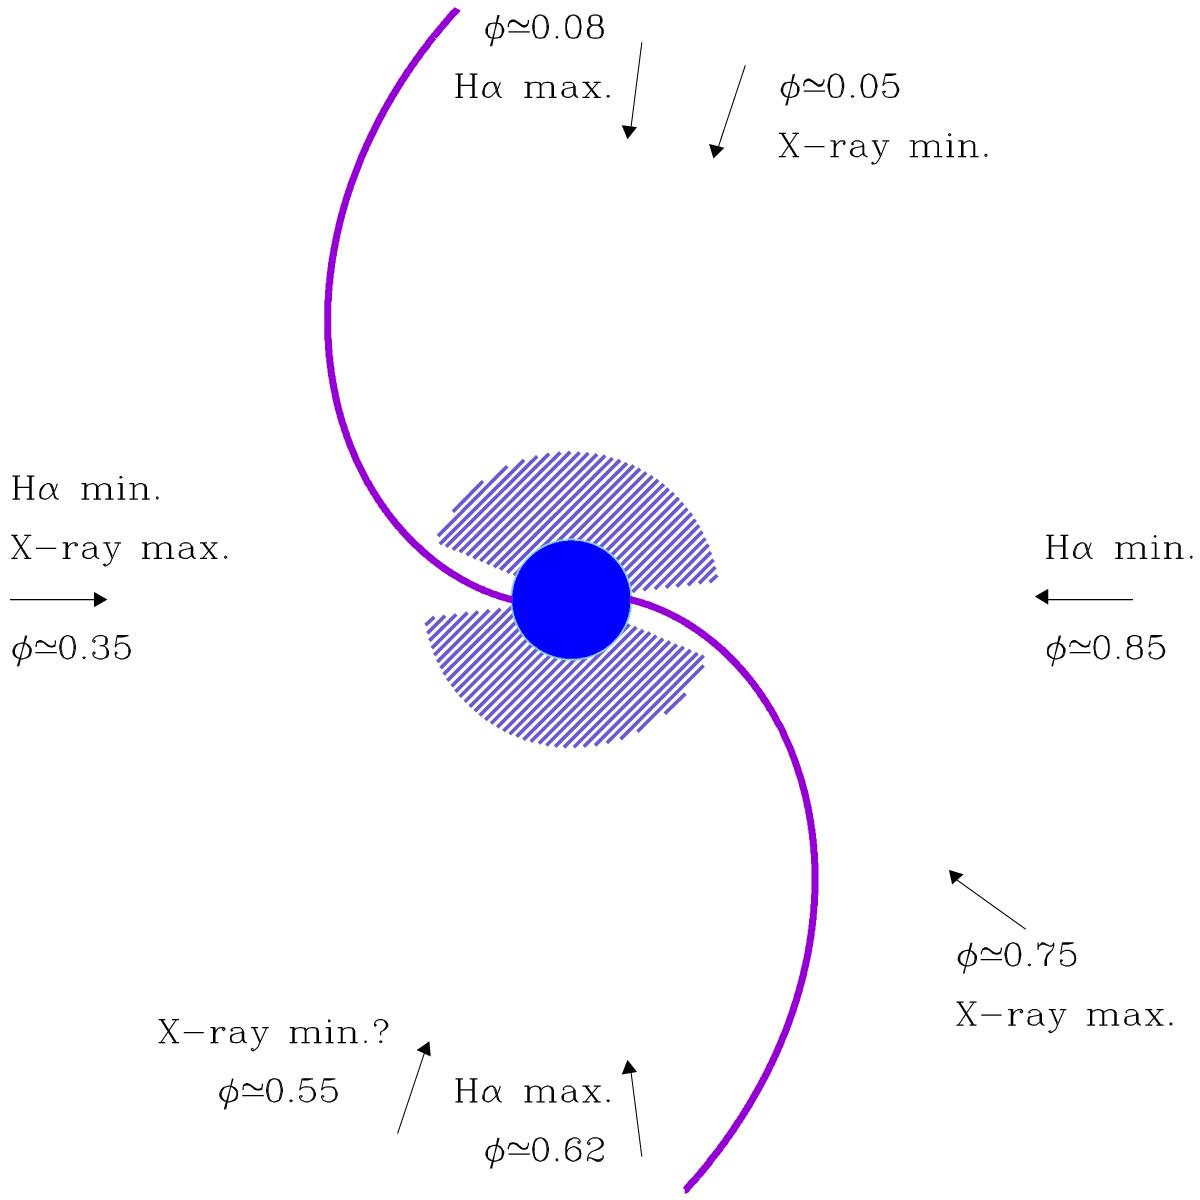
Cartoon of the CIRs in the wind of λ Cep and its impact on the X-ray and Hα emission. The Hα emission region is shown by the blue hatched area. Outside the CIR, the X-ray emission region overlaps with the Hα emission region. Near the base of the CIR, excess X-ray emission is produced and Hα emission is reduced.
Current usage metrics show cumulative count of Article Views (full-text article views including HTML views, PDF and ePub downloads, according to the available data) and Abstracts Views on Vision4Press platform.
Data correspond to usage on the plateform after 2015. The current usage metrics is available 48-96 hours after online publication and is updated daily on week days.
Initial download of the metrics may take a while.