Fig. 2
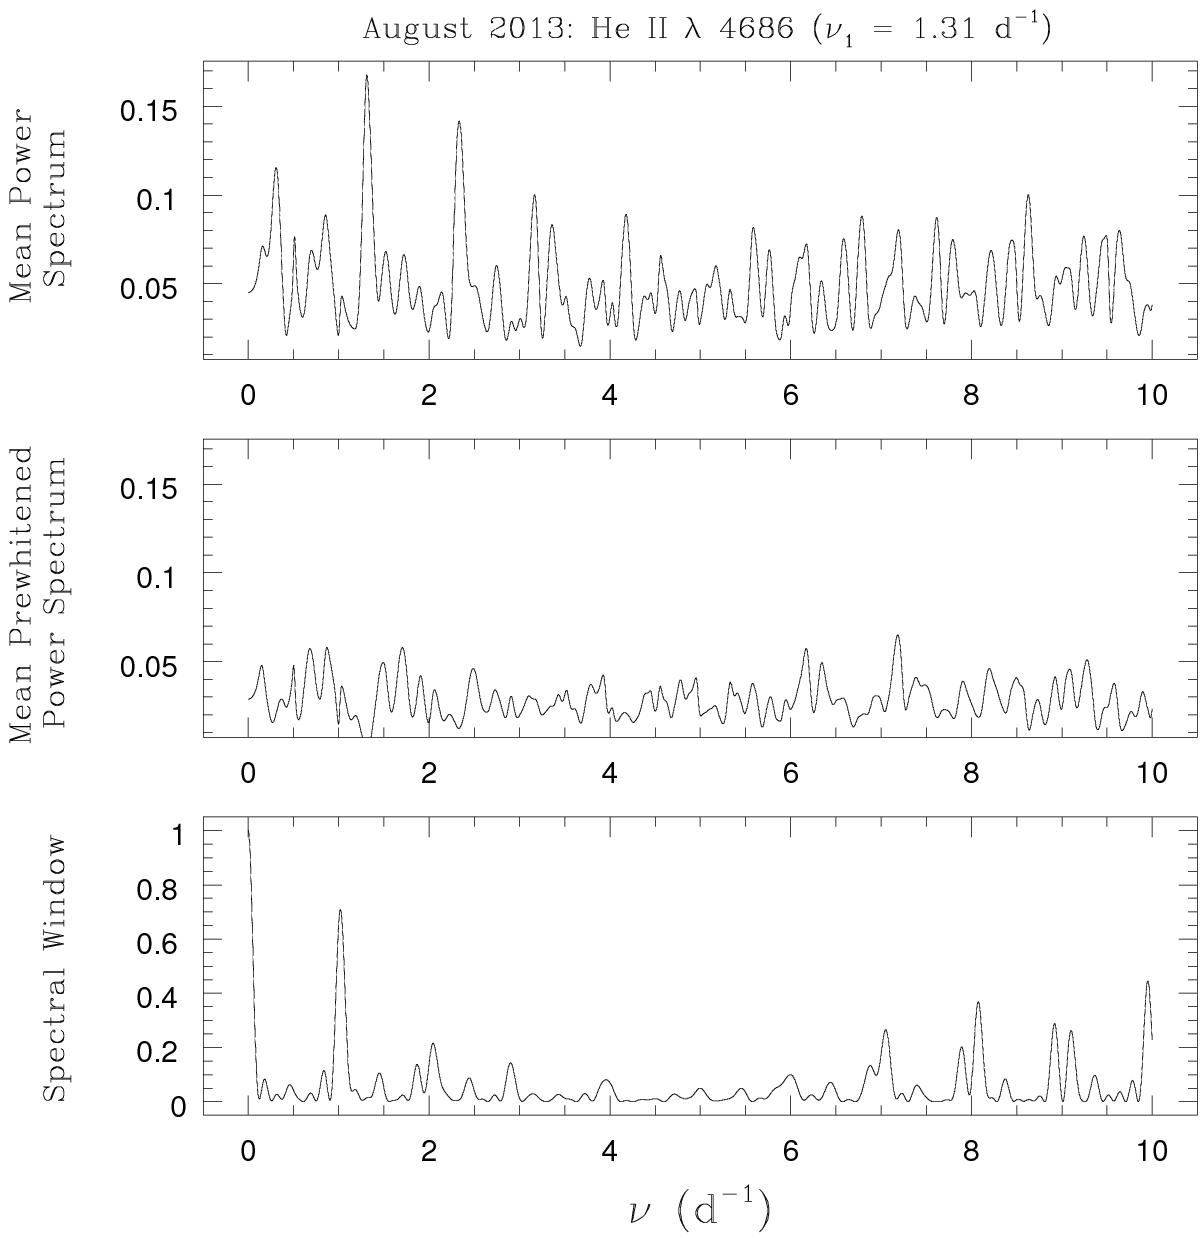
Periodogram of the He ii λ 4686 emission line as observed in August 2013. In the mean periodogram over the wavelength interval 4678−4692 Å, as computed from the time series of HEROS spectra (top panel), the highest peak is found at the frequency ν1 = 1.315 day-1. The residual periodogram, after prewhitening the data for the signal corresponding to the ν1 frequency, is shown in the middle panel. The bottom panel provides the power spectral window of our time series.
Current usage metrics show cumulative count of Article Views (full-text article views including HTML views, PDF and ePub downloads, according to the available data) and Abstracts Views on Vision4Press platform.
Data correspond to usage on the plateform after 2015. The current usage metrics is available 48-96 hours after online publication and is updated daily on week days.
Initial download of the metrics may take a while.