Fig. 19
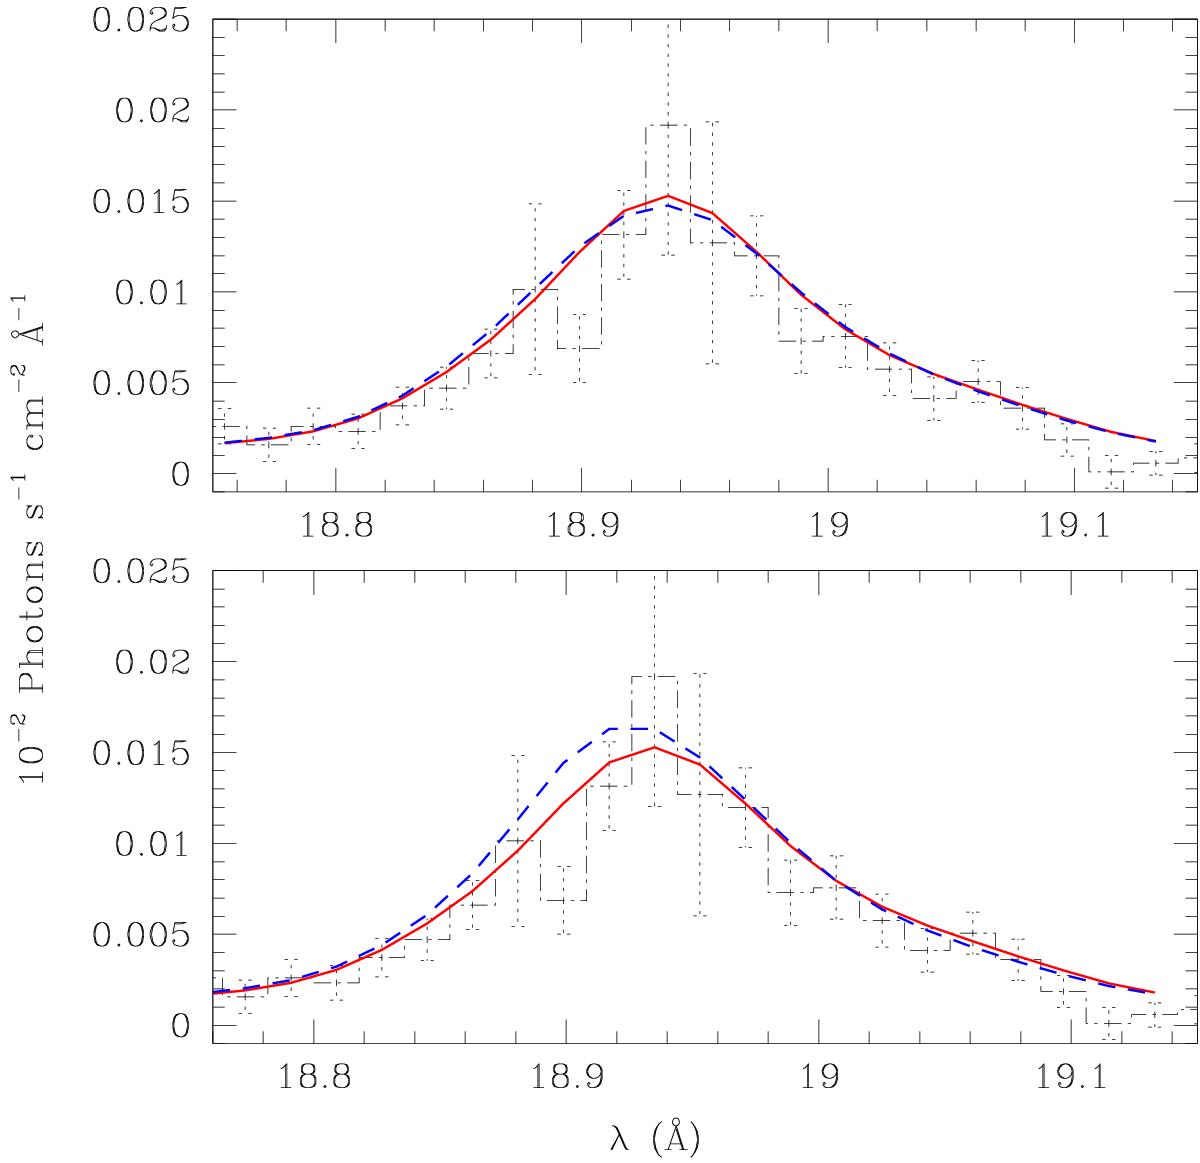
Impact of some model assumptions on the fits of the RGS spectrum of λ Cep, illustrated by the example of the O viii Lyα line. In the top panel, the red solid line illustrates the best-fit model (assuming minimum shell width of 0.1 R∗), whilst the blue dashed line corresponds to the best fit for a minimum shell width of 1 R∗. The histogram yields the observed line profile. The bottom panel shows the same figure, except for the blue dashed line which corresponds now to the best fit where we have artificially set the onset radius of the X-ray emission region to be located at r ≥ 2 R∗.
Current usage metrics show cumulative count of Article Views (full-text article views including HTML views, PDF and ePub downloads, according to the available data) and Abstracts Views on Vision4Press platform.
Data correspond to usage on the plateform after 2015. The current usage metrics is available 48-96 hours after online publication and is updated daily on week days.
Initial download of the metrics may take a while.