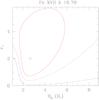
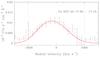
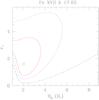
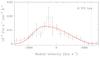
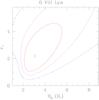
Fig. 14
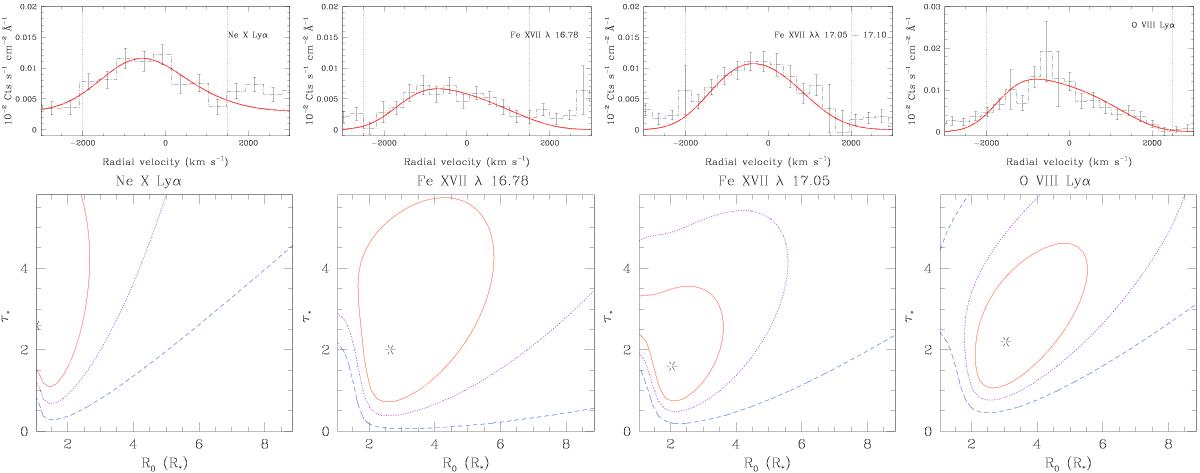
Fits of four individual lines in the RGS spectrum of λ Cep. For each row, the top panel illustrates the best-fit model convolved with the RGS response and compared with the observed profile. The bottom panel shows the 68.3 (1σ, red continous line), 90 (violet dotted line) and 99% (blue dashed line) confidence contours in the τ∗ versus R0 parameter space. The asterisks indicate the best-fit parameters.
Current usage metrics show cumulative count of Article Views (full-text article views including HTML views, PDF and ePub downloads, according to the available data) and Abstracts Views on Vision4Press platform.
Data correspond to usage on the plateform after 2015. The current usage metrics is available 48-96 hours after online publication and is updated daily on week days.
Initial download of the metrics may take a while.