Fig. 12
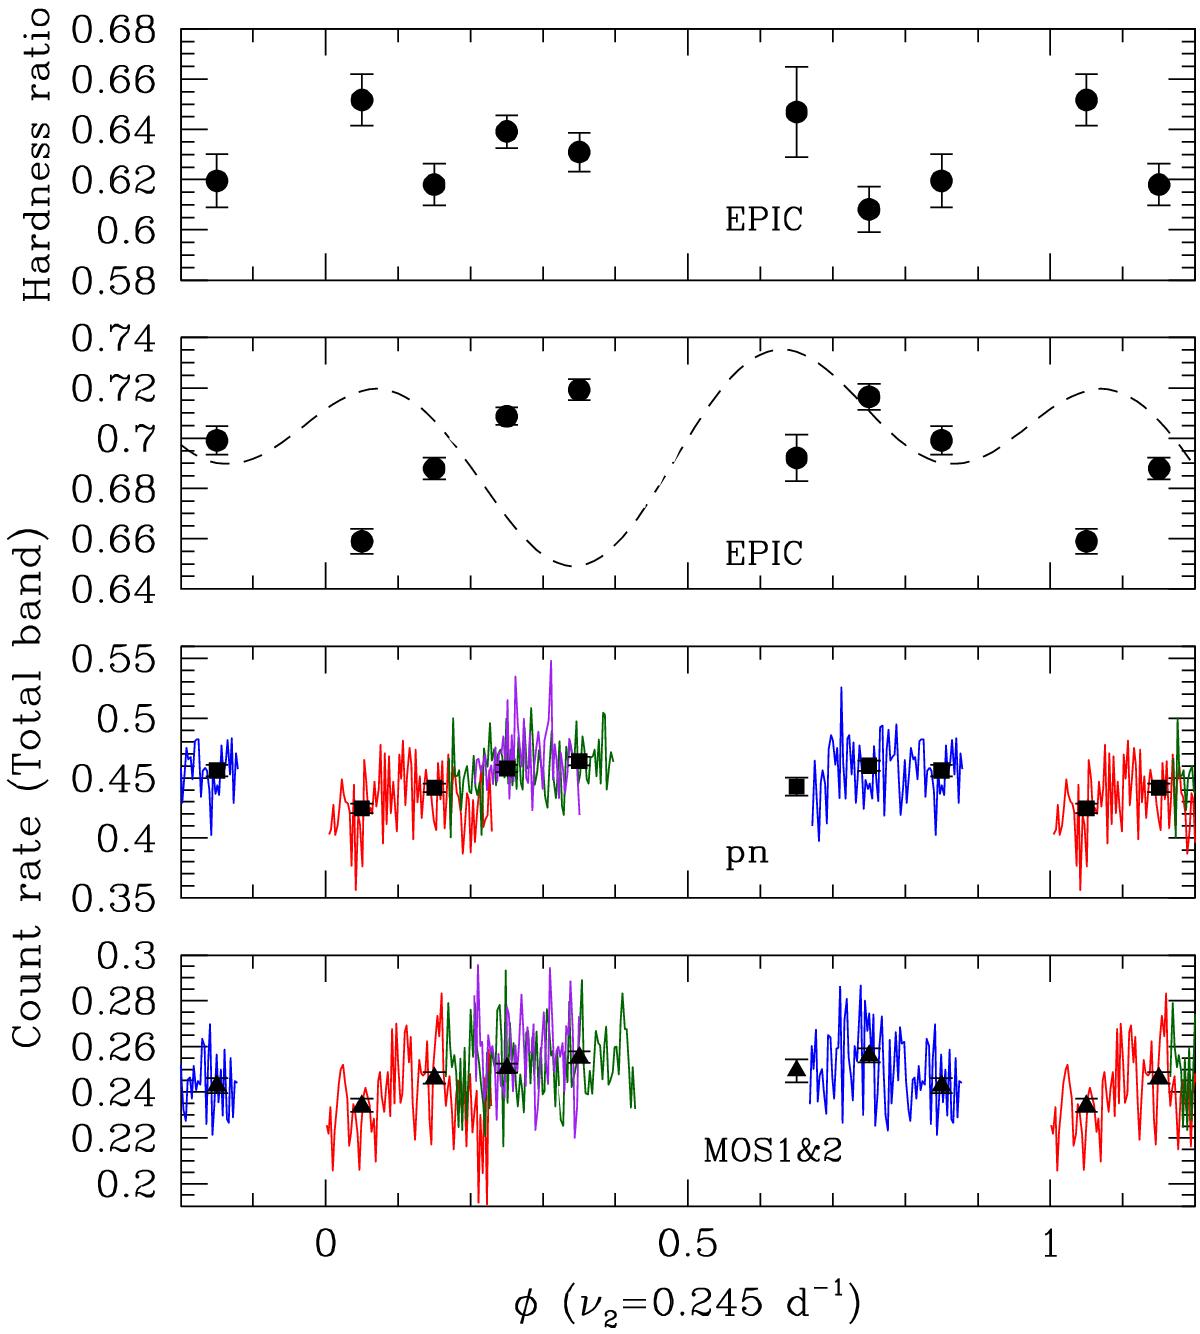
X-ray lightcurve of λ Cep folded in phase with the ν2 frequency. The red, blue, green and purple curves correspond to the background-corrected count rates as measured during observations I, II, III and IV respectively. These lightcurves were binned into 1 ks bins. The filled symbols with error bars indicate the lightcurve binned into phase intervals of 0.1. Phase 0.0 was again taken as the starting time of observation I. From bottom to top the results are shown for the combination of the two MOS detectors, for the pn, for the combination of all three EPIC instruments and for the hardness ratio derived for all three EPIC cameras. The dashed line in the second panel from the top represents the variations of the EW of the Hα line scaled to match the range of variability of the EPIC count rate and shifted by 0.36 in phase (with respect to Fig. 6) to match the phase 0.0 of the folded X-ray lightcurve.
Current usage metrics show cumulative count of Article Views (full-text article views including HTML views, PDF and ePub downloads, according to the available data) and Abstracts Views on Vision4Press platform.
Data correspond to usage on the plateform after 2015. The current usage metrics is available 48-96 hours after online publication and is updated daily on week days.
Initial download of the metrics may take a while.