Fig. 11
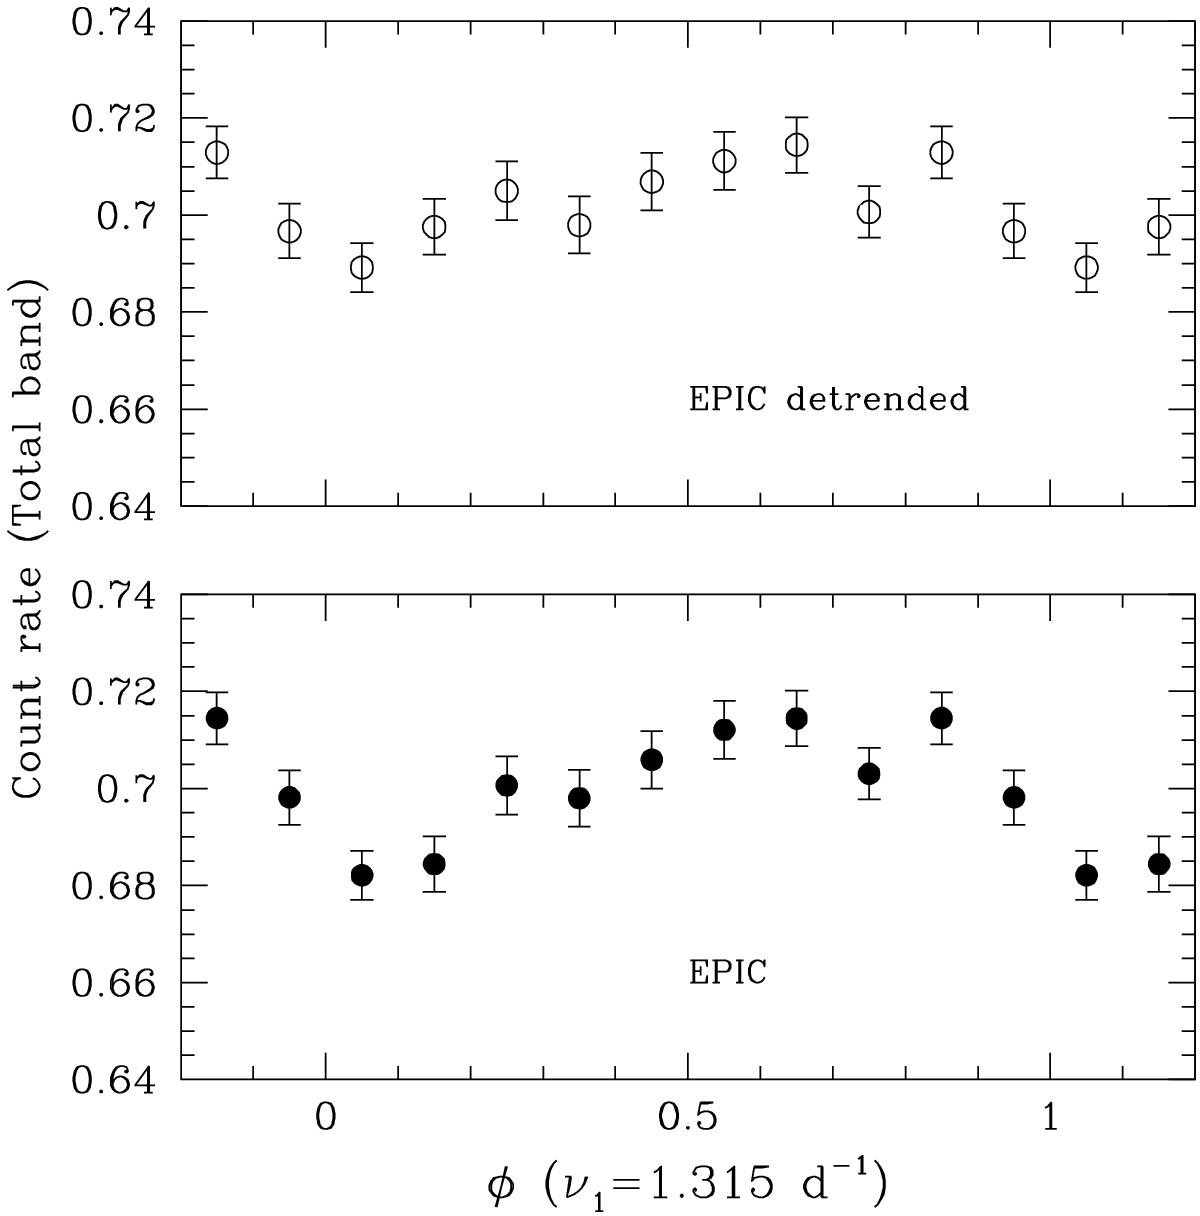
X-ray lightcurve of the full EPIC (MOS1 + MOS2 + pn) count rate folded in phase with the ν1 frequency. The data were binned into phase intervals of 0.1 and phase 0.0 was arbitrarily taken as the starting time of observation I (HJD 2 456 456.1871). The bottom and top panels show the results for the background-corrected count rates and after removing the long-term trend from the background-corrected count rates, respectively (see text).
Current usage metrics show cumulative count of Article Views (full-text article views including HTML views, PDF and ePub downloads, according to the available data) and Abstracts Views on Vision4Press platform.
Data correspond to usage on the plateform after 2015. The current usage metrics is available 48-96 hours after online publication and is updated daily on week days.
Initial download of the metrics may take a while.