Fig. 4
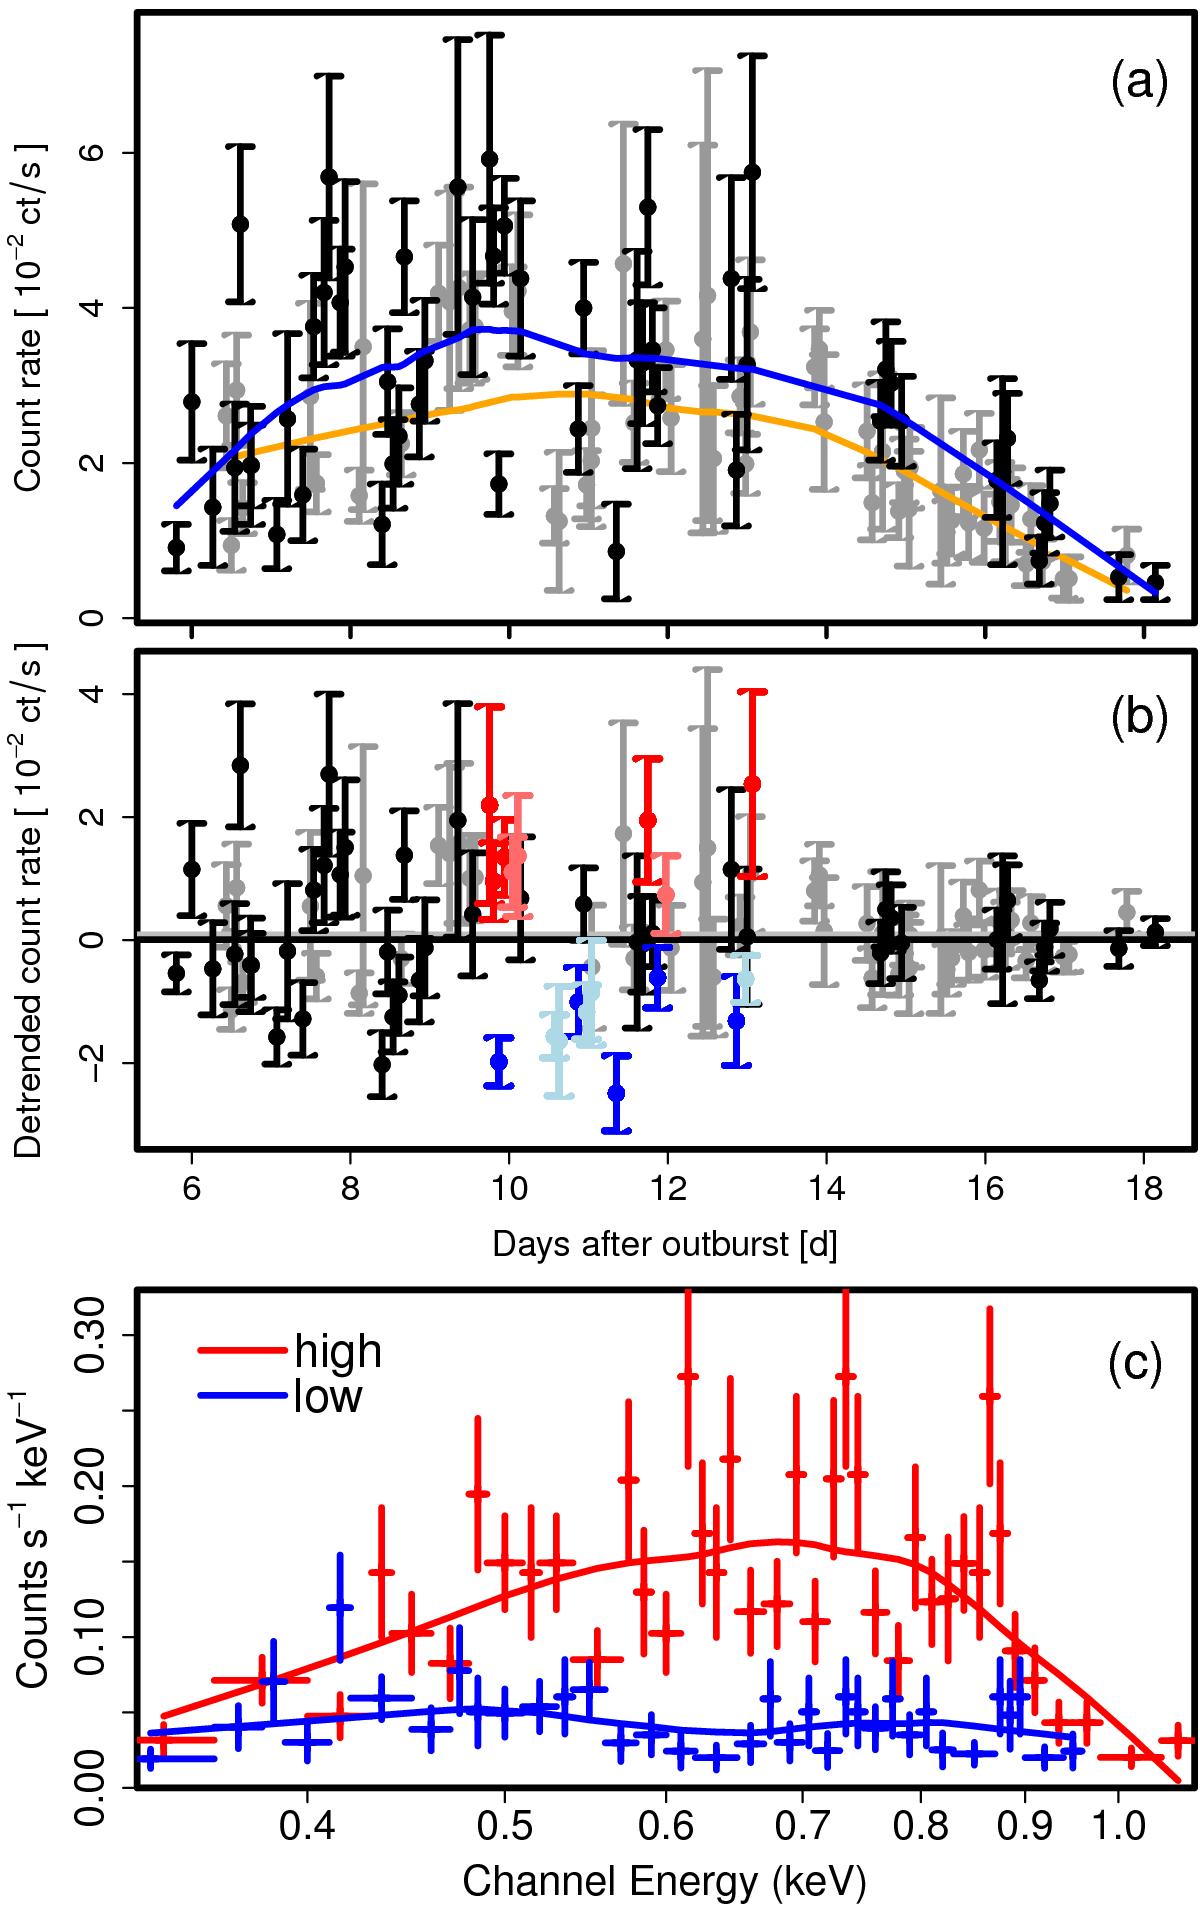
Panel a) the short-term X-ray light curve of M31N 2008-12a based on the individual XRT snapshots. Data points with error bars show the XRT count rates and corresponding errors (see Table 2) for the 2014 (black) and 2013 (grey) outbursts. We note that the count rate axis uses a linear scale in contrast to the logarithmic scale in Fig. 2. Solid lines represent smoothed fits, based on local regression, on the 2014 (blue) and 2013 (orange) data. Panel b) the light curves from panel a) have been de-trended by subtracting the smoothed fits from the respective data. The red (and light red) data points mark the count rates that are at least 1σ above the smoothed fit for the 2014 (2013) data during the temperature maximum. The blue (and light blue) data are at least 1σ below the average 2014 (2013) count rate for the same time range. Panel c) binned XRT spectra for all the high- (red colours) and low-luminosity (blue colours) snapshots of the 2014 and 2013 monitoring that are indicated in panel b) with corresponding colours.
Current usage metrics show cumulative count of Article Views (full-text article views including HTML views, PDF and ePub downloads, according to the available data) and Abstracts Views on Vision4Press platform.
Data correspond to usage on the plateform after 2015. The current usage metrics is available 48-96 hours after online publication and is updated daily on week days.
Initial download of the metrics may take a while.