Fig. 3
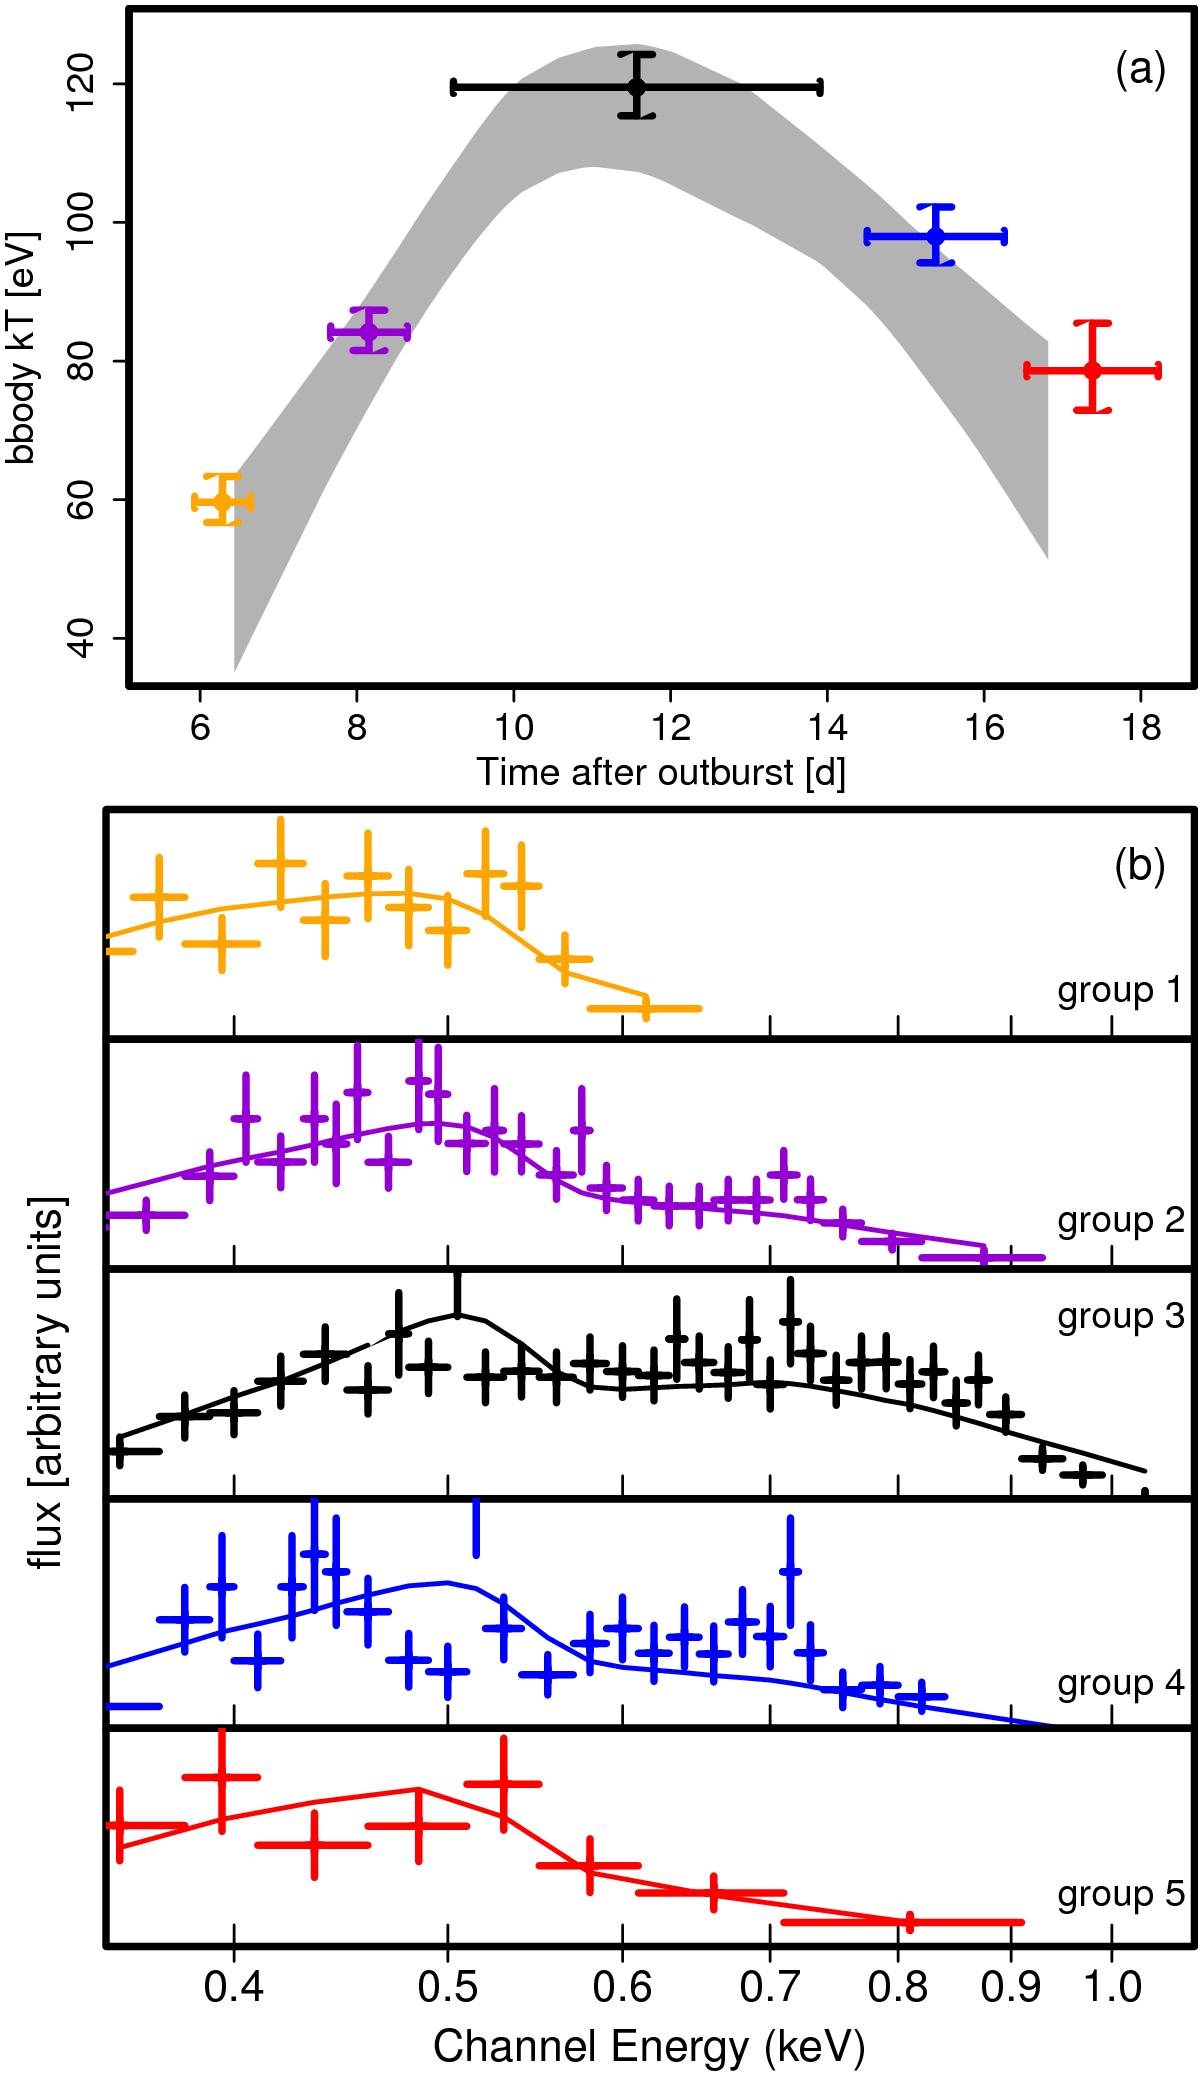
Panel a) the effective blackbody temperature of M31N 2008-12a depending on the time after outburst. Based on spectra from the 2014 and 2013 outburst (the latter described in HND2014). Sets of spectra with similar temperature (compare Fig. 2b) have been fitted simultaneously. Black/coloured data points show the best fit kT and corresponding uncertainty. The error bars in time after outburst extend from the first to the last observation of each group. The grey region shows the 95% confidence prediction interval derived from smoothing temperature fits based on individual snapshots (see Sect. 4.2 for details). Panel b) binned combined XRT spectra in arbitrary flux units with blackbody fits (solid lines). The colours correspond to the outburst stages in panel a).
Current usage metrics show cumulative count of Article Views (full-text article views including HTML views, PDF and ePub downloads, according to the available data) and Abstracts Views on Vision4Press platform.
Data correspond to usage on the plateform after 2015. The current usage metrics is available 48-96 hours after online publication and is updated daily on week days.
Initial download of the metrics may take a while.